
15 Days Price Change
Metropolitan Stock Exchange (MSEI) Unlisted Shares
-
Metropolitan Stock Exchange (MSEI)

-
916668

Metropolitan Stock Exchange (MSEI) Unlisted Shares
-
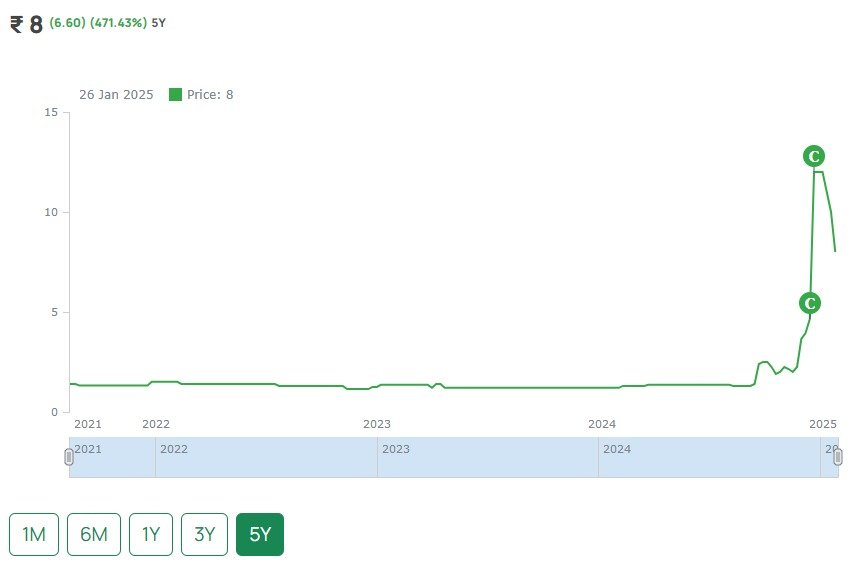
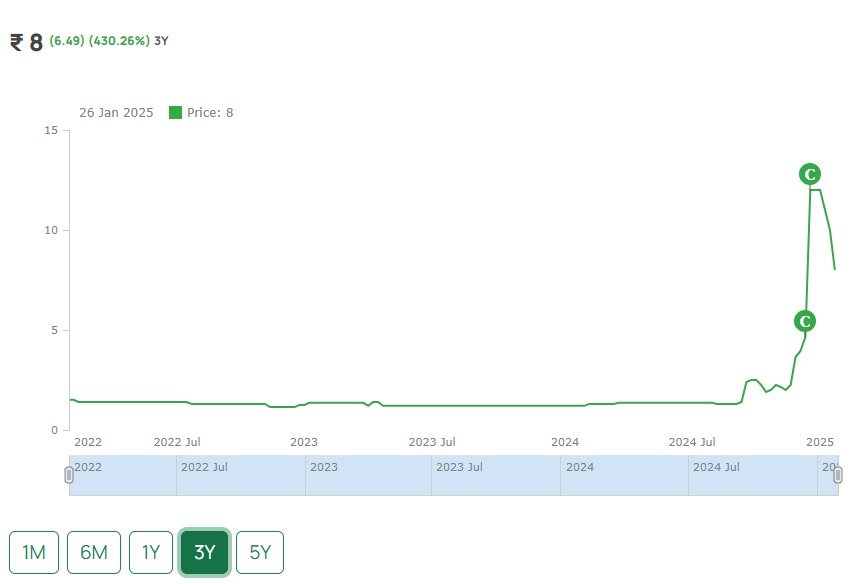
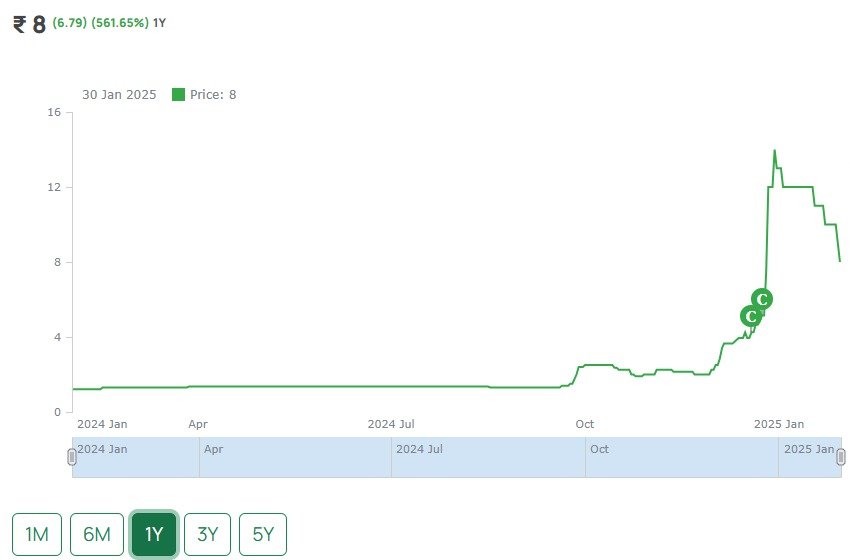
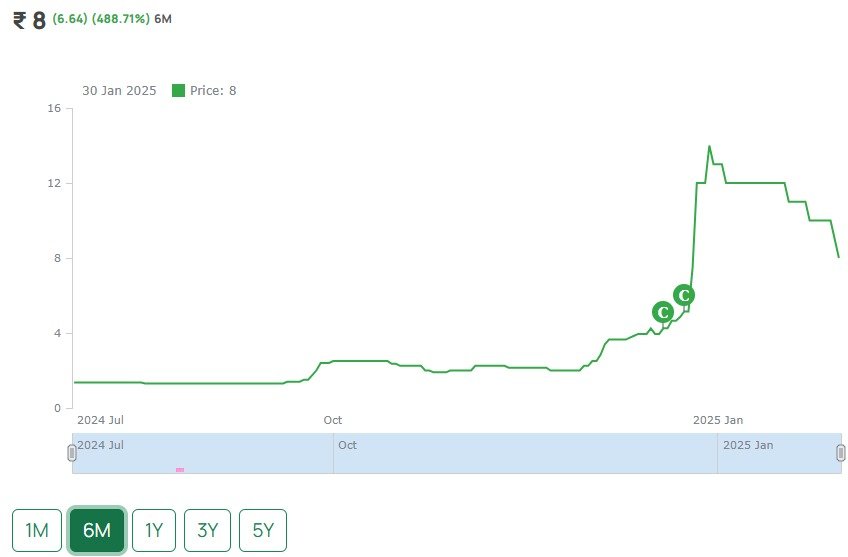
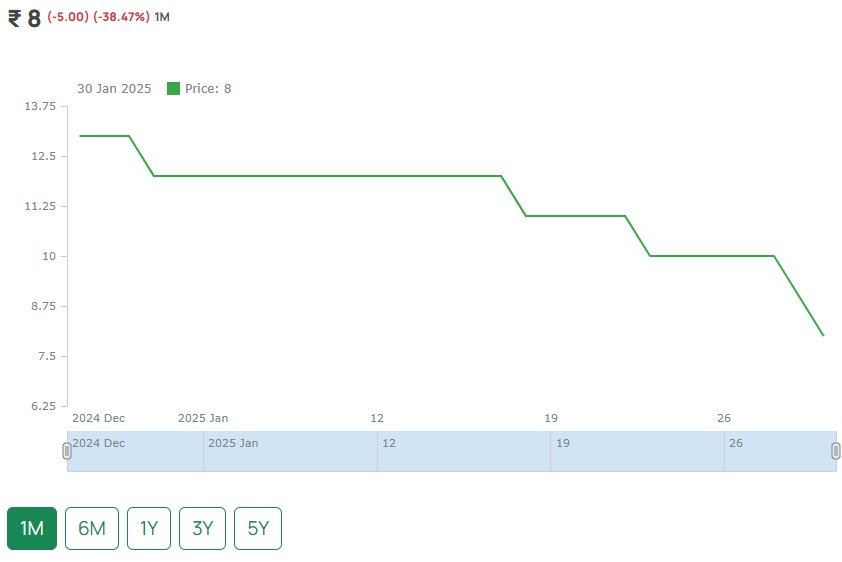
₹ 8
-
(6.60) (471.43%) 5Y
5 Year
3 Year
1 Year
6 Month
1 Month
About Metropolitan Stock Exchange (MSEI) Unlisted Shares
Metropolitan Stock Exchange of India Limited (MSEI) is a full-service national level Stock Exchange with a license to operate in Equity, Equity Derivatives, Currency Derivatives, Debt, and SME Platform. It has a live trading platform in all segments except SME. MSEIL has two subsidiaries: Metropolitan Clearing Corporation of India Limited (MCCIL) and MCX SX KYC Registration Agency Limited (MRAL) in which it holds 86.94 and 100 percent. MCCIL is in the business of clearing and settlement of deals in multi-asset classes carried out at MSEIL and MRAL is in the business of maintaining a database for members of the exchange and other under the Know Your Client (KYC) Guidelines.
Key Highlights
(i) The ownership of MSEIL is diversified between corporates, banks, and individuals.
(ii) The shareholding of MSEIL consists of Banks/Flls at 23.64% which
includes leading public and private sector banks like State Bank of India, Bank of
Baroda, Punjab National Bank, Axis Bank, HDFC Bank, etc.
(iii) Leading
Corporates and institutions hold around 29.94% which includes Edelweiss Commodities
Services Limited, IL&FS Financial Services Limited, Multi Commodity Exchange of
India Limited, etc. (iv) Individual Investors hold around 40.47% which includes
leading investors like Mr. Rakesh Jhunjhunwala, Mr. Radhakishan Damani, Mr. Nemish
Shah among others.
Fundamentals
Per Equity Share
Financials (Figures in Cr.)
P&L Statement
| P&L Statement | 2021 | 2022 | 2023 | 2024 |
|---|---|---|---|---|
| Revenue | 10.63 | 10 | 9 | 7 |
| Cost of Material Consumed | 16.95 | 17 | 23 | 29 |
| Gross Margins | -59.45 | -70 | -155.56 | -314.29 |
| Change in Inventory | 0 | 0 | 0 | 0 |
| Employee Benefit Expenses | 22.9 | 20 | 19 | 16 |
| Other Expenses | 11.27 | 8 | 16 | 16 |
| EBITDA | -40.49 | -35 | -49 | -54 |
| OPM | -380.9 | -350 | -544.44 | -771.43 |
| Other Income | 21.82 | 15 | 40 | 14 |
| Finance Cost | 0.83 | 0.6 | 0.4 | 1 |
| D&A | 11.17 | 10 | 11 | 6 |
| EBIT | -51.66 | -45 | -60 | -60 |
| EBIT Margins | -485.98 | -450 | -666.67 | -857.14 |
| PBT | -30.67 | -31 | -20 | -48 |
| PBT Margins | -288.52 | -310 | -222.22 | -685.71 |
| Tax | 0.41 | -1 | -1.3 | 1 |
| PAT | -31.08 | -30 | -18.7 | -49 |
| NPM | -292.38 | -300 | -207.78 | -700 |
| EPS | -0.06 | -0.06 | -0.04 | -0.1 |
Financial Ratios |
2021 | 2022 | 2023 | 2024 |
|---|---|---|---|---|
| Operating Profit Margin | -380.9 | -350 | -544.44 | -771.43 |
| Net Profit Margin | -292.38 | -300 | -207.78 | -700 |
| Earning Per Share (Diluted) | -0.06 | -0.06 | -0.04 | -0.1 |
Balance Sheet
| Assets | 2021 | 2022 | 2023 | 2024 |
|---|---|---|---|---|
| Fixed Assets | 8.65 | 24 | 14 | 11.5 |
| CWIP | 2.6 | 2 | 0.4 | 0 |
| Investments | 73.9 | 81 | 73 | 49 |
| Trade Receivables | 1.6 | 4 | 1 | 3 |
| Inventory | 0 | 0 | 0 | 0 |
| Other Assets | 404.82 | 340 | 210.6 | 185.5 |
| Total Assets | 491.57 | 451 | 299 | 249 |
| Liabilities | 2021 | 2022 | 2023 | 2024 |
|---|---|---|---|---|
| Share Capital | 480.52 | 480.5 | 480.5 | 480.5 |
| FV | 1 | 1 | 1 | 1 |
| Reserves | -188.77 | -220 | -239 | -288 |
| Borrowings | 0 | 0 | 0 | 0 |
| Trade Payables | 1.36 | 0.58 | 1 | 3 |
| Other Liabilities | 198.46 | 189.92 | 56.5 | 53.5 |
| Total Liabilities | 491.57 | 451 | 299 | 249 |
Cash-Flow Statement
| Cash-Flow Statement | 2021 | 2022 | 2023 | 2024 |
|---|---|---|---|---|
| PBT | -31.07 | -31 | -18 | -49 |
| OPBWC | -38.24 | -35 | -44 | -55 |
| Change in Receivables | -0.82 | -2 | 3.4 | -1 |
| Change in Inventories | 0 | 0 | 0 | 0 |
| Change in Payables | 0.14 | -0.8 | 0.3 | -2 |
| Other Changes | -4.38 | -7.7 | -129 | -1 |
| Working Capital Change | -5.06 | -10.5 | -125.3 | -4 |
| Cash Generated From Operations | -43.3 | -45.5 | -169.3 | -59 |
| Tax | 5.38 | 0.8 | -3 | 2 |
| Cash Flow From Operations | -37.92 | -44.7 | -172.3 | -57 |
| Purchase of PPE | -6.99 | -4.5 | -3 | -2 |
| Sale of PPE | 0.02 | 0 | 0 | 0 |
| Cash Flow From Investment | 31.23 | 60.5 | 168 | 9 |
| Borrowing | 0 | 0 | 0 | 0 |
| Divided | 0 | 0 | 0 | 0 |
| Equity | 0 | 0 | 0 | 0 |
| Others From Financing | -4.38 | -3 | -3.3 | -2 |
| Cash Flow from Financing | -4.38 | -3 | -3.3 | -2 |
| Net Cash Generated | -11.07 | 12.8 | -7.6 | -50 |
| Cash at the Start | 12.97 | 1.9 | 15 | 63 |
| Cash at the End | 1.9 | 14.7 | 7.4 | 13 |
Shareholding Pattern
Peer Ratio
| Particulars (cr) | Revenue (Fy24) | EPS (FY24) | Mcap (21.10.24) | P/E (21.10.24) |
| Metropolitan Stock Exchange (MSEI) | 14780 | 34 | 470250 | 55x |
| BSE | 1592 | 57 | 57203 | 96x |
Metropolitan Stock Exchange (MSEI) Unlisted Shares
₹ 8


Buy or sell shares with ease – Contact Us Today!