
15 Days Price Change
National Commodity & Derivatives Exchange (NCDEX) Unlisted Shares
-
National Commodity & Derivatives Exchange (NCDEX)

-
74989

National Commodity & Derivatives Exchange (NCDEX) Unlisted Shares
-
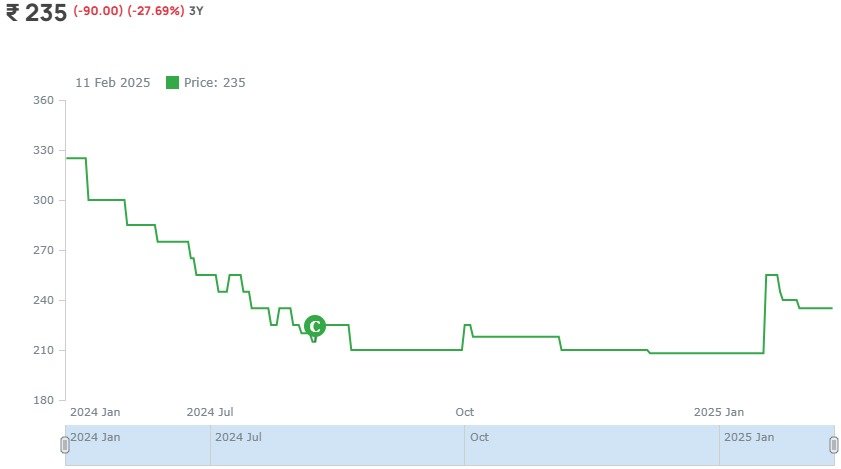
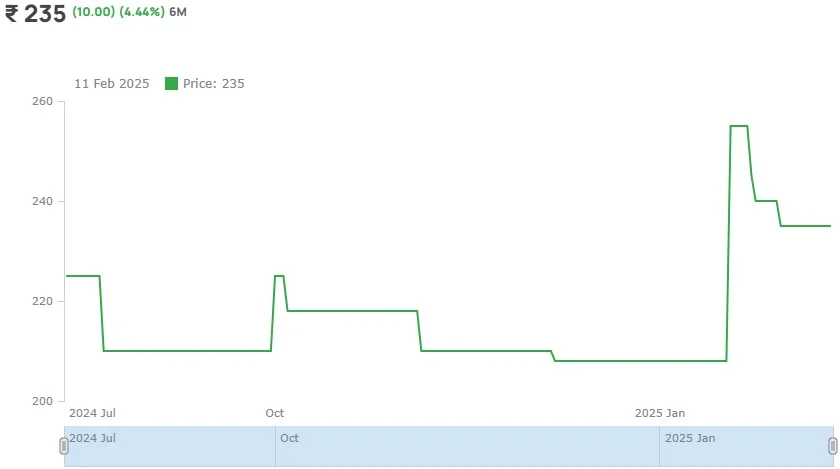
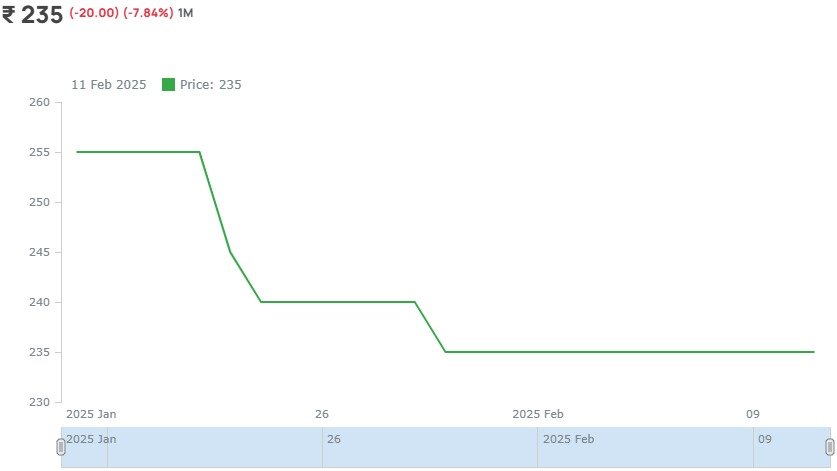
₹ 235
-
(-90.00) (-27.69%) 5Y
5 Year

3 Year
1 Year

6 Month
1 Month
About National Commodity & Derivatives Exchange (NCDEX) Unlisted Shares
Introduction
The National Commodity & Derivatives Exchange Limited (NCDEX) is a prominent on-line commodities exchange, specializing in a diverse range of agricultural and non-agricultural derivative products. Established on April 23, 2003, as a public limited company, NCDEX began its operations on December 15, 2003. The Exchange transitioned to a deemed recognized stock exchange under the Securities Contracts (Regulation) Act, 1956, on September 28, 2015, regulated by the SEBI.
Mission and Functionality
Mission: NCDEX serves as a reliable platform for price discovery and risk management, consistently offering a wide array of derivative products that meet the needs of various stakeholders in the commodity value chain.
Functions:
- Price Benchmarking: NCDEX prices are considered benchmarks in the domestic and global commodities markets.
- Diverse Products: Offers commodity futures, options in goods, and index futures.
- Technology Leadership: First Indian exchange to operate from a Tier-IV data center, ensuring secure and efficient trading.
Market Presence and Impact
- Market Transparency: NCDEX's online platform enhances market transparency, helping farmers better price their products.
- Middleman Elimination: Reduces the role of middlemen by providing direct market access to farmers and traders.
- Agricultural Practices: Contracts standardize quality specifications, increasing awareness and improving crop quality.
- Demat Account: Enables electronic trading of agricultural commodities, simplifying transactions for traders
Shareholders and Governance
Key shareholders include Life Insurance Corporation of India (LIC), National Bank for Agriculture and Rural Development (NABARD), National Stock Exchange of India Limited (NSE), Canara Bank, Punjab National Bank (PNB), and Indian Farmers Fertiliser Cooperative Limited (IFFCO). NCDEX's board of directors consists of experts in agricultural markets and derivatives.
Primary Traded Commodities
NCDEX trades 23 permitted agricultural commodities, such as pulses, spices, and guar,
which are not commonly traded globally but hold economic significance for India.
This broad-based array positions NCDEX as a leading exchange for agricultural
derivatives.
Why NCDEX has incurred losses in FY22-23?
Q1: What was the impact of commodity suspensions at the start of FY 2022-23 on NCDEX?
- A: The suspensions of key commodities had an adverse effect on the overall performance of the exchange.
Q2: What was the Average Daily Traded Value (ADTV) for NCDEX in FY 2022-23?
- A: The ADTV for FY 2022-23 was ₹ 834 Crores.
Q3: How did the Average Daily Open Interest (ADOI) change in FY 2022-23 compared to the previous year?
- A: The ADOI increased to ₹ 2,069 Crores in FY 2022-23, marking a 6% growth from ₹ 1,947 Crores in the previous financial year.
Q4: How did the ADTV for continuing contracts change in FY 2022-23?
- A: The ADTV for continuing contracts saw a marginal reduction.
Q5: What does the increase in Open Interest indicate?
- A: The increase in Open Interest indicates strong support from value chain participants.
Q6: What percentage of the Exchange's volumes were previously contributed by suspended commodities?
- A: Suspended commodities previously contributed to 70% of the Exchange's volumes.
Q7: What was the impact on deposits and deliveries due to the loss of suspended contracts?
- A: The impact on deposits and deliveries was contained to a 20% loss despite the suspensions.
This Q&A format summarizes the key points regarding the performance and challenges faced by NCDEX in FY 2022-23
Q1FY2025 Results of NCDEX
| Particulars (In Cr) | Q1FY25 | Q1FY24 |
| Revenue From Operations | 17 | 24 |
| Employees Benefit Expenses | 24 | 23 |
| Technology Expenses | 11 | 10 |
| Other Expenses | 6 | 6 |
| EBITDA | -24 | -15 |
| OPM (%) | -141.18% | -62.50% |
| Other Income | 7 | 7 |
| Depreciation | 5 | 6 |
| Finance Cost | 0.29 | 0.32 |
| Exceptional Income | 48 | 0 |
| Share of Net Profit from JV and other | 3 | 2 |
| PBT | 29 | -13 |
| Tax | 6 | -3 |
| PAT | 23 | -10 |
| NPM (%) | 95.83% | -32.26% |
| EPS (₹) | 4.5 | -1.9 |
Fundamentals
Per Equity Share
Financials (Figures in Cr.)
P&L Statement
| P&L Statement | 2021 | 2022 | 2023 | 2024 |
|---|---|---|---|---|
| Revenue | 113 | 115 | 104 | 96 |
| Cost of Material Consumed | 0 | 0 | 11 | 0 |
| Gross Margins | 100 | 100 | 89.42 | 100 |
| Change in Inventory | 0 | 0 | 0 | 0 |
| Employee Benefit Expenses | 72 | 81 | 88 | 91 |
| Other Expenses | 75 | 69 | 71 | 70 |
| EBITDA | -34 | -35 | -66 | -65 |
| OPM | -30.09 | -30.43 | -63.46 | -67.71 |
| Other Income | 39 | 45 | 35 | 58 |
| Finance Cost | 1 | 2 | 1.5 | 1.3 |
| D&A | 25 | 24 | 25 | 25 |
| EBIT | -59 | -59 | -91 | -90 |
| EBIT Margins | -52.21 | -51.3 | -87.5 | -93.75 |
| PBT | -21 | -17 | -58 | -33 |
| PBT Margins | -18.58 | -14.78 | -55.77 | -34.37 |
| Tax | -7 | -5 | -16 | -5 |
| PAT | -14 | -12 | -42 | -28 |
| NPM | -12.39 | -10.43 | -40.38 | -29.17 |
| EPS | -2.76 | -2.37 | -8.29 | -5.52 |
Financial Ratios |
2021 | 2022 | 2023 | 2024 |
|---|---|---|---|---|
| Operating Profit Margin | -30.09 | -30.43 | -63.46 | -67.71 |
| Net Profit Margin | -12.39 | -10.43 | -40.38 | -29.17 |
| Earning Per Share (Diluted) | -2.76 | -2.37 | -8.29 | -5.52 |
Balance Sheet
| Assets | 2021 | 2022 | 2023 | 2024 |
|---|---|---|---|---|
| Fixed Assets | 13 | 10 | 8 | 43 |
| CWIP | 0 | 0 | 0 | 4 |
| Investments | 79 | 36 | 88 | 113 |
| Trade Receivables | 31 | 29 | 32 | 23 |
| Inventory | 0 | 0 | 0 | 0 |
| Other Assets | 954 | 856 | 748 | 658 |
| Total Assets | 1077 | 931 | 876 | 841 |
| Liabilities | 2021 | 2022 | 2023 | 2024 |
|---|---|---|---|---|
| Share Capital | 50.68 | 50.68 | 50.68 | 50.68 |
| FV | 10 | 10 | 10 | 10 |
| Reserves | 456 | 455 | 424 | 425 |
| Borrowings | 0 | 0 | 0 | 0 |
| Trade Payables | 12 | 11 | 9 | 9 |
| Other Liabilities | 558.32 | 414.32 | 392.32 | 356.32 |
| Total Liabilities | 1077 | 931 | 876 | 841 |
Cash-Flow Statement
| Cash-Flow Statement | 2021 | 2022 | 2023 | 2024 |
|---|---|---|---|---|
| PBT | -21 | -17 | -58 | -33 |
| OPBWC | -24 | -23 | -62 | -52 |
| Change in Receivables | 1 | 1 | -3 | 8.6 |
| Change in Inventories | 0 | 0 | 0 | 0 |
| Change in Payables | -3 | -5 | 0 | 0.3 |
| Other Changes | 91 | -146 | -31 | 6.1 |
| Working Capital Change | 89 | -150 | -34 | 15 |
| Cash Generated From Operations | 65 | -173 | -96 | -37 |
| Tax | 29 | -8 | -1 | -18 |
| Cash Flow From Operations | 94 | -181 | -97 | -55 |
| Purchase of PPE | -13 | -14 | -14 | -12 |
| Sale of PPE | 0 | 1 | 0 | 1 |
| Cash Flow From Investment | 48 | 52 | 97 | 96 |
| Borrowing | 0 | 0 | 0 | 0 |
| Divided | -1.88 | -2.42 | -2.28 | 0 |
| Equity | 0.06 | 0.03 | 0.05 | 0 |
| Others From Financing | -8.18 | -5.61 | -5.77 | -6 |
| Cash Flow from Financing | -10 | -8 | -8 | -6 |
| Net Cash Generated | 132 | -137 | -8 | 35 |
| Cash at the Start | 121 | 253 | 72 | 64 |
| Cash at the End | 253 | 116 | 64 | 99 |
Shareholding Pattern
Peer Ratio
| Particulars (cr) | Revenue (Fy24) | PAT (Fy24) | P/E (17/01/2025) | Mcap (17/01/2025) |
| NCDEX | 96 | -29 | NA | 1500 Cr |
| MCX | 684 | 83 | 88x | 30000 Cr |
National Commodity & Derivatives Exchange (NCDEX) Unlisted Shares
₹ 63


Buy or sell shares with ease – Contact Us Today!