
15 Days Price Change
NSE India Limited Unlisted Shares
-
NSE

-
839627


NSE India Limited Unlisted Shares
-
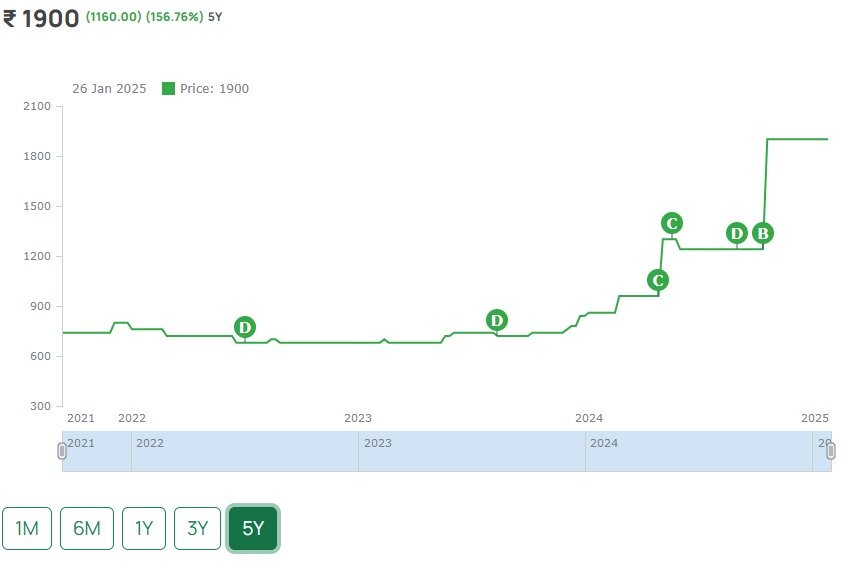
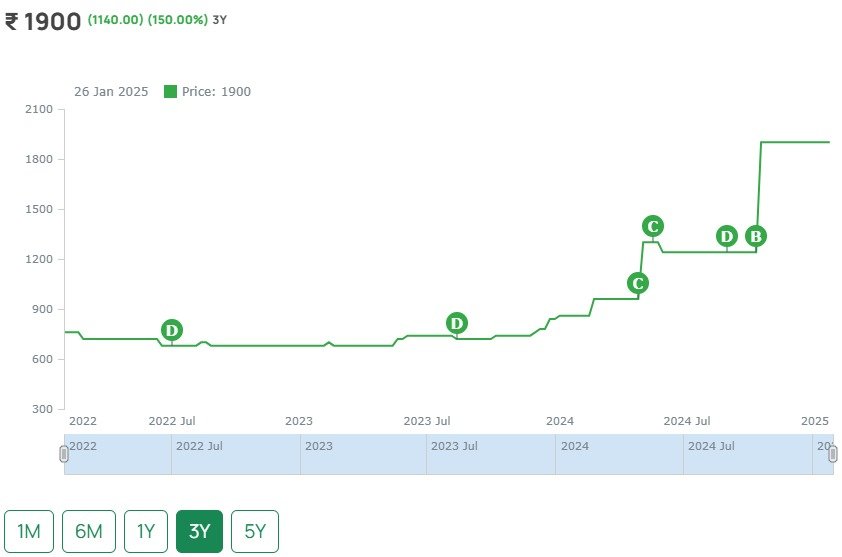
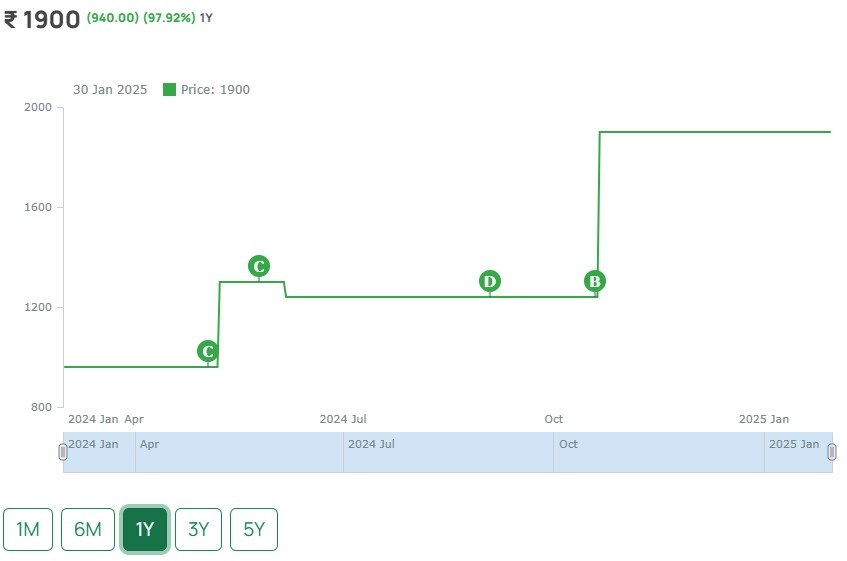
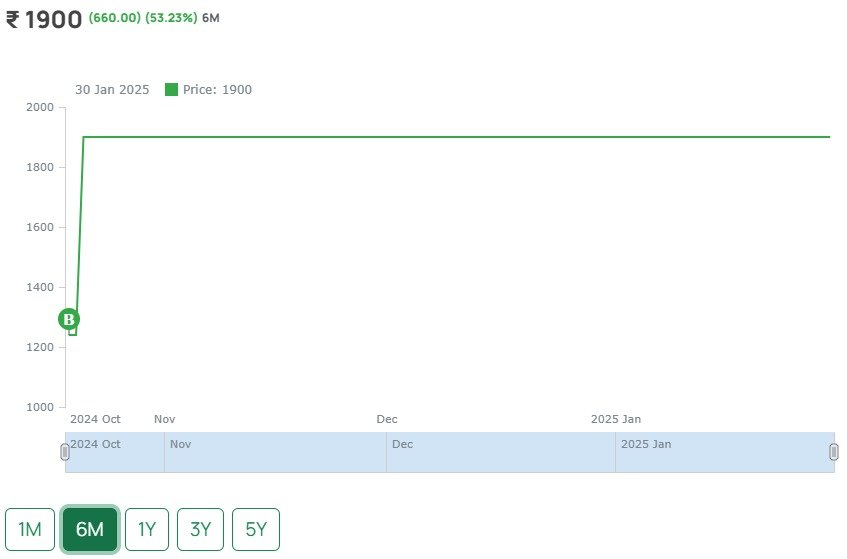
₹ 1900
-
(1160.00) (156.76%) 5Y
5 Year
3 Year
1 Year
6 Month
1 Month
About NSE India Limited Unlisted Shares
(i) The National Stock Exchange of India Ltd. (NSE) is the leading stock exchange in
India and the second largest in the world by nos. of trades in equity shares from
January to June 2018, according to the World Federation of Exchanges (WFE)
report.
(ii) NSE launched electronic screen-based trading in 1994,
derivatives trading (in the form of index futures), and internet trading in 2000,
which were each the first of its kind in India.
(iii) NSE has a
fully-integrated business model comprising our exchange listings, trading services,
clearing and settlement services, indices, market data feeds, technology solutions,
and financial education offerings. NSE also oversees compliance by trading and
clearing members and listed companies with the rules and regulations of the
exchange.
(iv) NSE is a pioneer in technology and ensures the reliability and
performance of its systems through a culture of innovation and investment in
technology. NSE believes that the scale and breadth of its products and services
sustained leadership positions across multiple asset classes in India and globally
enable it to be highly reactive to market demands and changes and deliver innovation
in both trading and non-trading businesses to provide high-quality data and services
to market participants and clients.
(v) NSE was incorporated in 1992. It was
recognized as a stock exchange by SEBI in April 1993 and commenced operations in
1994 with the launch of the wholesale debt market, followed shortly after by the
launch of the cash market segment.
History of
NSE
1995: Setup wholly-owned subsidiary, NSE
Clearing, which became the first clearing corporation to be established in India
(according to the Oliver Wyman Report). NSE Clearing commenced clearing and
settlement operations in the following year.
1998:
Established NSE Indices, their subsidiary, as a joint venture with CRISIL Limited to
operate an indices business. NSE Indices became a wholly-owned subsidiary in 2013
following the acquisition of CRISIL's 49% stake.
1999:
Established NSEIT, a wholly-owned subsidiary and a global technology firm that
provides end-to-end technology solutions, including application services,
infrastructure services, analytics as a service, and IT-enabled services. In 2015
and 2016, respectively, NSEIT launched its Testing Center of Excellence and
Integrated Security Response Center
2000: Incorporated
DotEx, a wholly-owned subsidiary, and consolidated the data and info-vending
business under DotEx.
2006: Incorporated NSE Infotech
Ltd., a wholly-owned subsidiary for IT research and
development.
2016: Consolidated the education business under
NSE Academy, a wholly-owned subsidiary. Incorporated two new subsidiaries, NSE IFSC
Limited and NSE IFSC Clearing Corporation Limited, in furtherance of NSE's long-term
business strategy to establish an international exchange in GIFT City.
Subsidiaries of NSE:
| Name of Entity | Place of Incorporation | Ownership % |
| NSE Clearing Limited (formerly known as National Securities Clearing Corporation Limited) | India | 100 |
| NSE Investments Ltd (formerly known as NSE Strategic Investment Corporation Limited) | India | 100 |
| NSEIT Limited | India | 100 |
| NSEIT (US) Inc. | United States of America | 100 |
| NSE Indices Ltd (formerly known as India Index Services & Products Limited) | India | 100 |
| NSE Data & Analytics Limited (formerly known as DotEx International Limited) | India | 100 |
| NSE Infotech Services Limited | India | 100 |
| NSE IFSC Limited | India | 100 |
| NSE IFSC Clearing Corporation Limited | India | 100 |
| NSE Academy Limited | India | 100 |
| NSE Foundation (Section 8 Company) | India | 100 |
| Aujas Networks Private Limited | India | 95.39 |
NSE Unlisted Share Price Movement
NSE is one of the
top-performing shares in the unlisted market which makes it always a better choice
for investors to invest in. The unlisted shares in the last year have been
consistently falling up to 50%. Despite the massive fall in the majority of unlisted
shares, NSE has gone up from INR 3400 per share to INR 3700 per share. In August
2022, the NSE Unlisted share price was Rs. 3400 which is now Rs. 3700.
Current Valuation of NSE Unlisted Share Price in the market
In the unlisted market, the NSE unlisted share price is Rs.3700 per share and total outstanding shares as on 31.03.2023 were ~50 Crores. So, the valuation of NSE in the unlisted market is Rs.1,85,000 Crores. The valuation in the last 3 years has gone up by 3x. The same growth is reflected in the Revenue and PAT of NSE in the last 3 years making it still an undervalued stock. As per the trends of Option volumes on the exchanges, this valuation will increase further.
IPO News
The IPO of NSE was expected to take place in the next 2 years. In the past, market regulator SEBI passed an order on NSE over the violation of securities contract rules and some probes initiated by some agencies in a co-location case which resulted in a delay in the IPO. However, the co-location case has already been settled by SAT and SC also directed SEBI to return 1000 Cr they have taken in the co-location case. However, the SEBI has gone for an appeal and same will be heard in Sept-23.
Fundamentals
Per Equity Share
Financials (Figures in Cr.)
P&L Statement
| P&L Statement | 2021 | 2022 | 2023 | 2024 |
|---|---|---|---|---|
| Revenue | 5624 | 8929 | 11856 | 14780 |
| Cost of Material Consumed | 0 | 0 | 0 | 0 |
| Gross Margins | 100 | 100 | 100 | 100 |
| Change in Inventory | 0 | 0 | 0 | 0 |
| Employee Benefit Expenses | 479 | 689 | 366 | 460 |
| Other Expenses | 1004 | 1740 | 1859 | 2709 |
| EBITDA | 4141 | 6500 | 9631 | 11611 |
| OPM | 73.63 | 72.8 | 81.23 | 78.56 |
| Other Income | 577 | 570 | 794 | 13 |
| Finance Cost | 0 | 0 | 0 | 0 |
| D&A | 226 | 338 | 384 | 439 |
| EBIT | 3915 | 6162 | 9247 | 11172 |
| EBIT Margins | 69.61 | 69.01 | 77.99 | 75.59 |
| PBT | 4464 | 6912 | 10041 | 11184 |
| PBT Margins | 79.37 | 77.41 | 84.69 | 75.67 |
| Tax | 891 | 1714 | 2540 | 2778 |
| PAT | 3573 | 5198 | 7501 | 8406 |
| NPM | 63.53 | 58.21 | 63.27 | 56.87 |
| EPS | 72.18 | 105.01 | 151.54 | 169.82 |
Financial Ratios |
2021 | 2022 | 2023 | 2024 |
|---|---|---|---|---|
| Operating Profit Margin | 73.63 | 72.8 | 81.23 | 78.56 |
| Net Profit Margin | 63.53 | 58.21 | 63.27 | 56.87 |
| Earning Per Share (Diluted) | 72.18 | 105.01 | 151.54 | 169.82 |
Balance Sheet
| Assets | 2021 | 2022 | 2023 | 2024 |
|---|---|---|---|---|
| Fixed Assets | 831 | 1129 | 1007 | 1004 |
| CWIP | 10 | 90 | 98 | 32 |
| Investments | 9362 | 12856 | 17305 | 10471 |
| Trade Receivables | 998 | 1614 | 1589 | 1865 |
| Inventory | 0 | 0 | 0 | 0 |
| Other Assets | 18004.5 | 19918.5 | 16565 | 52092 |
| Total Assets | 29205.5 | 35607.5 | 36564 | 65464 |
| Liabilities | 2021 | 2022 | 2023 | 2024 |
|---|---|---|---|---|
| Share Capital | 49.5 | 49.5 | 49.5 | 49.5 |
| FV | 1 | 1 | 1 | 1 |
| Reserves | 11586 | 11635 | 20429 | 23925 |
| Borrowings | 0 | 0 | 0 | 0 |
| Trade Payables | 0 | 0 | 262 | 332 |
| Other Liabilities | 17570 | 23923 | 15823.5 | 41157.5 |
| Total Liabilities | 29205.5 | 35607.5 | 36564 | 65464 |
Cash-Flow Statement
| Cash-Flow Statement | 2021 | 2022 | 2023 | 2024 |
|---|---|---|---|---|
| PBT | 4464 | 6912 | 9913 | 11104 |
| OPBWC | 2143 | 6306 | 9314 | 9133 |
| Change in Receivables | -357 | -646 | -216 | -298 |
| Change in Inventories | 0 | 0 | 0 | 0 |
| Change in Payables | 74 | 108 | 54 | 71 |
| Other Changes | 1906 | 1686 | -5059 | 24781 |
| Working Capital Change | 1623 | 1148 | -5221 | 24554 |
| Cash Generated From Operations | 3766 | 7454 | 4093 | 33687 |
| Tax | -862 | -1622 | -2358 | -3943 |
| Cash Flow From Operations | 2904 | 5832 | 1735 | 29744 |
| Purchase of PPE | -377 | -599 | -406 | -470 |
| Sale of PPE | 0 | 0 | 3 | 1 |
| Cash Flow From Investment | -2402 | -4185 | -3217 | -8336 |
| Borrowing | 0 | 0 | 0 | 0 |
| Divided | -544 | -1224 | -2079 | -3959 |
| Equity | 0 | 0 | 0 | 0 |
| Others From Financing | -26 | -34 | -21 | -35 |
| Cash Flow from Financing | -570 | -1258 | -2100 | -3994 |
| Net Cash Generated | -68 | 389 | -3582 | 17414 |
| Cash at the Start | 9237 | 9169 | 9557 | 5975 |
| Cash at the End | 9169 | 9558 | 5975 | 23389 |
Shareholding Pattern
Peer Ratio
| Particulars (cr) | Revenue (Fy24) | EPS (FY24) | Mcap (21.10.24) | P/E (21.10.24) |
| NSE | 14780 | 34 | 470250 | 55x |
| BSE | 1592 | 57 | 57203 | 96x |