
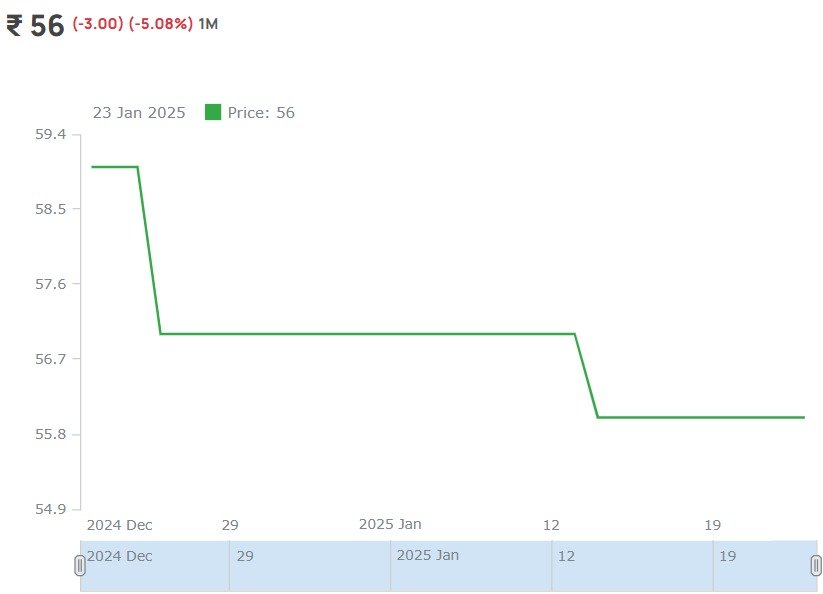
15 Days Price Change
Oravel Stays Limited (OYO Unlisted Shares)
-
OYO

-
453751

Oravel Stays Limited (OYO Unlisted Shares)
-
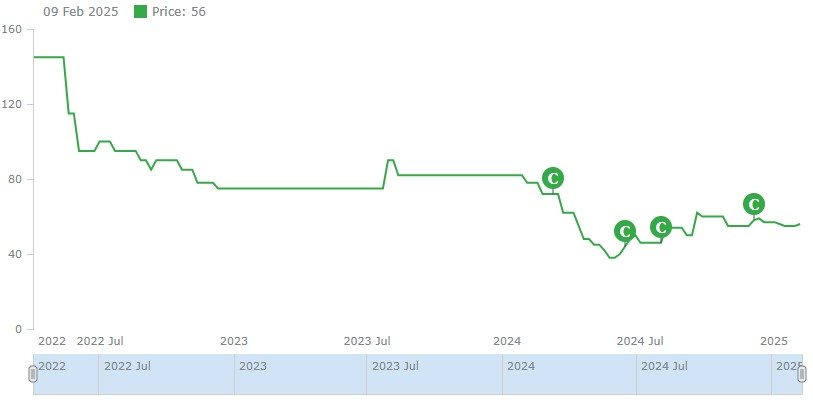
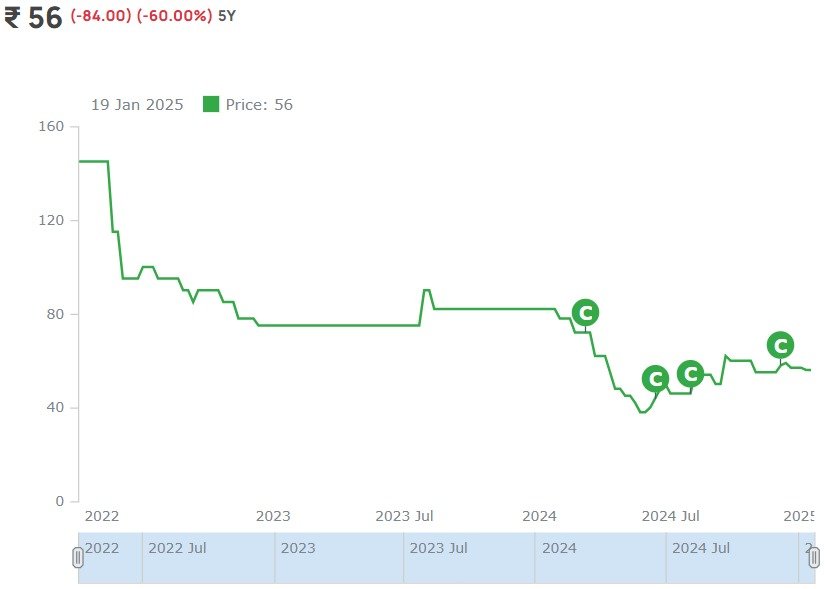
₹ 56
-
(-84.00) (-60.00%) 5Y
5 Year
3 Year
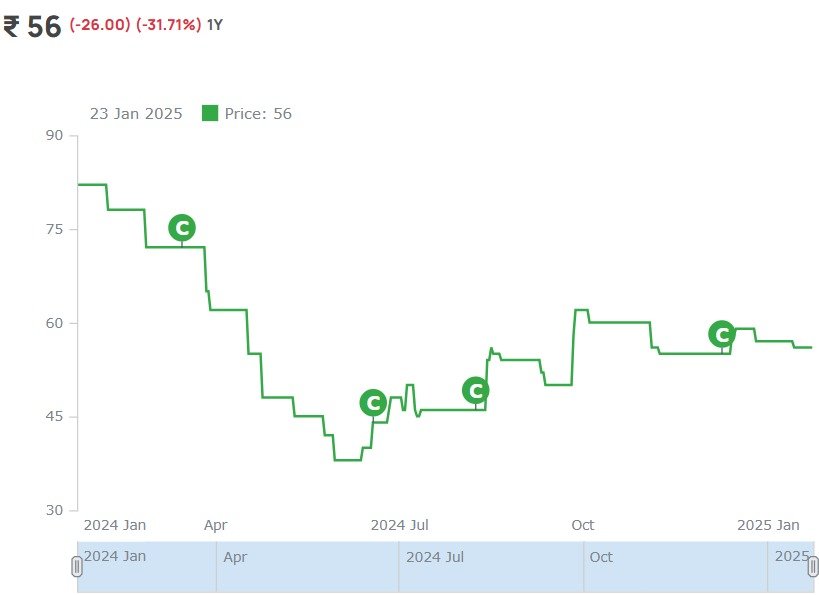
1 Year
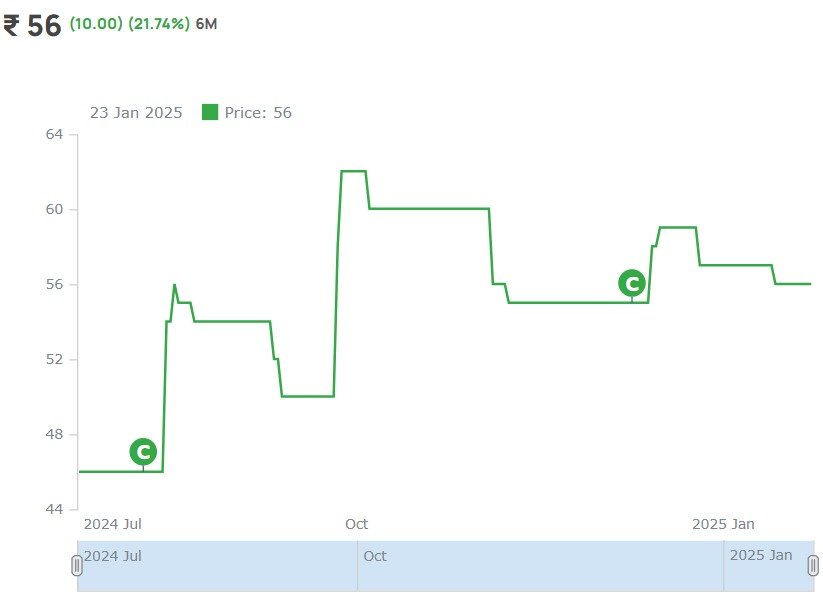
6 Month
1 Month
About ORAVEL STAYS LIMITED (Oyo Unlisted Shares)
Brief about OYO
(i) Oyo is a leading, new-age
technology platform empowering the large yet highly fragmented global hospitality ecosystem,
according to RedSeer. They have been focused on reshaping the short-stay accommodation space
since its incorporation in 2012 and have developed a unique two-sided technology platform
focused on comprehensively addressing key pain points of the Patrons (being the owners,
lessors and/or operators of storefronts listed on the platform) on the supply side and the
Customers (being travelers and guests who book accommodations at the Patrons’
storefronts through the platform) on the demand side. The unique business model helps the
Patrons transform fragmented, unbranded and under-utilized hospitality assets into branded,
digitally enabled storefronts with higher revenue generation potential and provides the
Customers with access to a broad range of high-quality storefronts at compelling price
points.
(ii) As at March 31, 2021, they had 157,344 storefronts
across more than 35 countries listed on the platform. The Patrons use the platform to manage
all mission-critical aspects of their business operations. The comprehensive, full-stack
technology suite integrates more than 40 products and services across the digital signup and
onboarding, revenue management, daily business management and D2C stacks into the two
flagship Patron applications, Co-OYO and OYO OS. This enables the Patrons to have a
significant digital presence across the extensive distribution network. The Customers can
book storefronts through its own D2C channels on the platform and through indirect channels
with third-party OTAs. The OYO mobile application offers a variety of digital tools to guide
the Customers throughout their journey, including discovery, seamless booking, pre-stay
assistance and cancellations, digital check-ins as well as in-stay and post-stay services.
Business Model of OYO
OYO business model relies on
the Patrons who list their storefronts on its platform and its large base of Customers who
book accommodations at Patrons’ storefronts through OYO platform. The value
proposition to the Patrons of OYO hotel and homes business is based on our integrated,
full-stack technology suite, which empowers all mission-critical aspects of their business
operations. In turn, the Patrons provide them with distribution rights (largely on an
exclusive basis) and significant control over pricing decisions relating to their storefront
inventory, which enables them to maximize their revenue generation potential through the
dynamic pricing algorithms. They distribute Patrons’ hotel and home
storefront inventory through the D2C channels on the platform and through indirect channels
with third party OTAs and generally earn an average revenue share of 20% to 35% of GBV (net
of discounts and loyalty points), which creates strong alignment between OYO and its
Patrons. They also offer a listing only service, where Patrons can list their storefronts on
the platform for a fixed subscription fee.
Asset-light Model of
OYO
They have an asset-light business model and a lean cost
structure. They do not own the storefronts listed on the platform. As at March 31, 2021,
99.9% of the storefronts did not have contracts with minimum guarantees or fixed payout
commitments from us, with any investments, capital expenditure, storefront employee costs
and other expenses relating to the operation of such storefronts borne large.
Hotels Listed on OYO
They have 157,344 storefronts
across more than 35 countries listed on the platform as at March 31, 2021. As at September
9, 2021, they had the largest footprint in terms of hotel storefronts in India and SEA and
the second largest footprint in Europe in terms of home storefronts among full stack
short-stay accommodation players, according to RedSeer. They have made a conscious strategic
decision to focus on these geographies as the Core Growth Markets. These markets account for
more than 90% of the total storefronts globally as at March 31, 2021.
1. Revenue from operations increased from ~3900 Cr in Fy21 to
~4700 Cr Fy22.
2. Adj. EBITDA loss have reduced from ~1700 Cr
in Fy21 to ~470 Cr in Fy22.
3. Gross Booking Value increased
from ~6600 Cr in Fy21 to ~8100 Cr in Fy22.
4. OYO is now
shifting focus from rapid growth to sustainable growth to make OYO profitable.
5. Currently, OYO core focus markets are India, South East Asia
and Europe Homes.
6. IPO is expected to come in next
year.
Key takeaways from OYO 2022-23 Annual Reports
1. OYO reported a 14% increase in Total Income for FY23,
reaching ₹5602 crore from ₹4905 crore.
2. The company
significantly reduced its Net Losses by 34%
3. Adjusted EBITDA
losses also saw a remarkable decrease of 68%, narrowing to ₹-374 crore from ₹-1160 crore in
the previous year
4. The company has launched 10 Palette
resorts in cities including Jaipur, Hyderabad, and Mumbai, with plans to add 40 more Pallete
Resort to its portfolio by Q2 FY 2024.
5. IPO is expected to
come this Year.
Valuation of OYO Unlisted Shares
| Shareholidng as on 31.03.2023 | |||
| Equity Shares | 132 Cr | ||
| Preference shars | 473 Cr | Bonus 3999:1 | Conversion 1:1 |
| Series A | 80,160 | 320640000 | 320640000 |
| Series A1 | 111,730 | 446888430 | 446888430 |
| Series B | 102,250 | 408977910 | 408977910 |
| Series C | 166,690 | 666673470 | 666673470 |
| Series C1 | 104,600 | 418375560 | 418375560 |
| Series D | 322,790 | 1290917370 | 1290917370 |
| Series D1 | 12,910 | 51707250 | 51707250 |
| Series E | 137,000 | 547943160 | 547943160 |
| Series F | 143,750 | 574936410 | 574936410 |
| Series F2 | 800 | 3279360 | 3279360 |
| 473 Cr | |||
| Total Shares | 605 Cr | ||
In the months of July and August-24, OYO raised approximately INR 1,457 crore in Series G funding at a price of around INR 30 per share. This infusion adds roughly 50 crore shares to the company's capital. Consequently, as of August 2024, the total outstanding shares stand at approximately ~650 crore.
With the stock price of OYO in the unlisted market at INR 45, this results in a valuation of INR 29,250 crore or approximately $3.65 billion.
Fundamentals
Per Equity Share
Financials (Figures in Cr.)
P&L Statement
| P&L Statement | 2021 | 2022 | 2023 | 2024 |
|---|---|---|---|---|
| Revenue | 3962 | 4781 | 5464 | 5389 |
| Cost of Material Consumed | 0 | 0 | 0 | 0 |
| Gross Margins | 100 | 100 | 100 | 100 |
| Change in Inventory | 0 | 0 | 0 | 0 |
| Employee Benefit Expenses | 1742 | 1862 | 1549 | 744 |
| Other Expenses | 4242 | 4079 | 4289 | 3937 |
| EBITDA | -2022 | -1160 | -374 | 708 |
| OPM | -51.03 | -24.26 | -6.84 | 13.14 |
| Other Income | 196 | 286 | 49 | 573 |
| Finance Cost | 560 | 746 | 681 | 844 |
| D&A | 392 | 299 | 280 | 200 |
| EBIT | -2414 | -1459 | -654 | 508 |
| EBIT Margins | -60.93 | -30.52 | -11.97 | 9.43 |
| PBT | -3877 | -1919 | -1286 | 236 |
| PBT Margins | -97.85 | -40.14 | -23.54 | 4.38 |
| Tax | 67 | 23 | 0 | 6 |
| PAT | -3944 | -1942 | -1286 | 230 |
| NPM | -99.55 | -40.62 | -23.54 | 4.27 |
| EPS | -1460740.74 | -14.63 | -9.68 | 1.72 |
Financial Ratios |
2021 | 2022 | 2023 | 2024 |
|---|---|---|---|---|
| Operating Profit Margin | -51.03 | -24.26 | -6.84 | 13.14 |
| Net Profit Margin | -99.55 | -40.62 | -23.54 | 4.27 |
| Earning Per Share (Diluted) | -1460740.74 | -14.63 | -9.68 | 1.72 |
Balance Sheet
| Assets | 2021 | 2022 | 2023 | 2024 |
|---|---|---|---|---|
| Fixed Assets | 1825 | 1605 | 1582 | 1490 |
| CWIP | 0 | 1 | 0 | 1.2 |
| Investments | 471 | 605 | 510 | 455 |
| Trade Receivables | 101 | 256 | 158 | 203 |
| Inventory | 0 | 0 | 0 | 0 |
| Other Assets | 6354 | 5985 | 5682 | 4293.8 |
| Total Assets | 8751 | 8452 | 7932 | 6443 |
| Liabilities | 2021 | 2022 | 2023 | 2024 |
|---|---|---|---|---|
| Share Capital | 0.027 | 132.7 | 132.8 | 133.8 |
| FV | 10 | 1 | 1 | 1 |
| Reserves | 2744 | 1311 | 449.7 | 767 |
| Borrowings | 3166 | 4664 | 5071 | 3603 |
| Trade Payables | 1143 | 1087 | 935 | 961 |
| Other Liabilities | 1697.97 | 1257.3 | 1343.5 | 978.2 |
| Total Liabilities | 8751 | 8452 | 7932 | 6443 |
Cash-Flow Statement
| Cash-Flow Statement | 2021 | 2022 | 2023 | 2024 |
|---|---|---|---|---|
| PBT | -3877 | -1919 | -1286 | 236 |
| OPBWC | -2044 | -575 | 264 | 815 |
| Change in Receivables | 442 | -128 | 192 | 5.5 |
| Change in Inventories | 16 | 8 | 0 | 0 |
| Change in Payables | -1391 | -148 | -330 | -74.8 |
| Other Changes | 598 | 23 | 49 | -127.7 |
| Working Capital Change | -335 | -245 | -89 | -197 |
| Cash Generated From Operations | -2379 | -820 | 175 | 618 |
| Tax | -53 | -102 | -33 | -20 |
| Cash Flow From Operations | -2432 | -922 | 142 | 598 |
| Purchase of PPE | -91 | -72 | -81 | -36 |
| Sale of PPE | 10 | 5 | 6.4 | 2 |
| Cash Flow From Investment | 1705 | -711 | -109 | 1425 |
| Borrowing | 424 | 1282 | -53 | -1661 |
| Divided | 0 | 0 | 0 | 0 |
| Equity | 0 | 22.3 | 0.9 | 0.19 |
| Others From Financing | -901 | -600.8 | -652.9 | -752.19 |
| Cash Flow from Financing | -477 | 703.5 | -705 | -2413 |
| Net Cash Generated | -1204 | -929.5 | -672 | -390 |
| Cash at the Start | 3469 | 2395 | 1430 | 796 |
| Cash at the End | 2265 | 1465.5 | 758 | 406 |
Oravel Stays Limited (OYO Unlisted Shares)
₹ 56

Buy or sell shares with ease – Contact Us Today!