
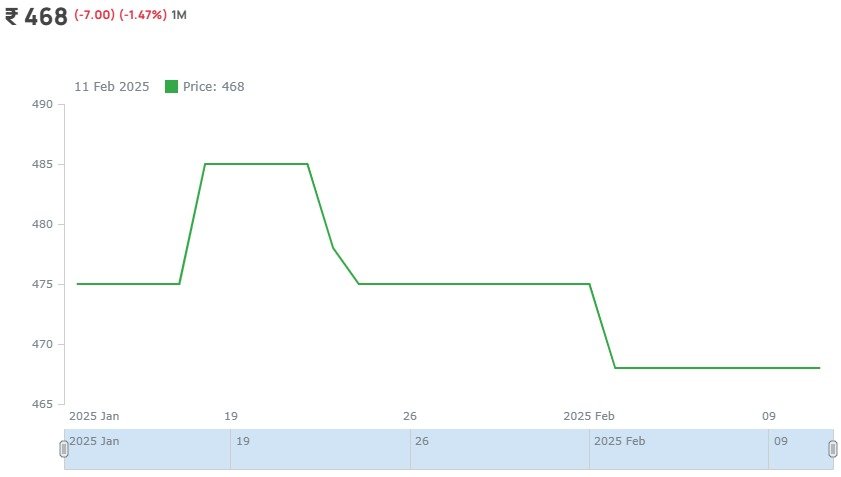
15 Days Price Change
ORBIS FINANCIAL CORPORATION Unlisted Shares
-
ORBIS FINANCIAL CORPORATION

-
916668

ORBIS FINANCIAL CORPORATION Unlisted Shares
-
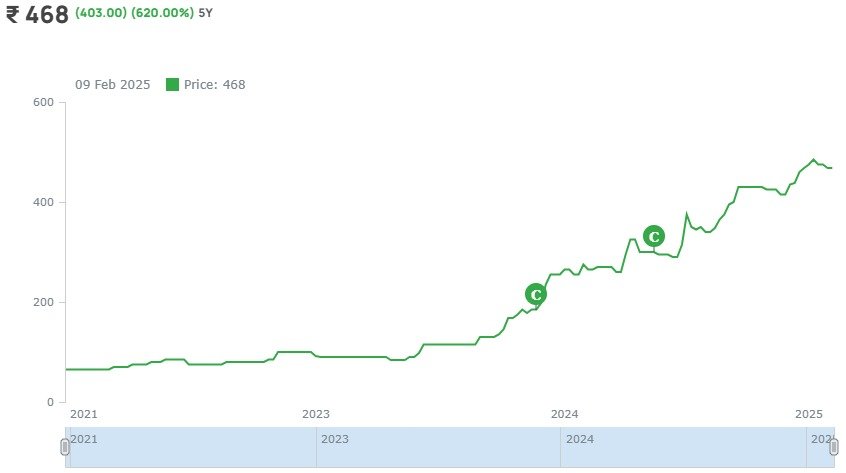
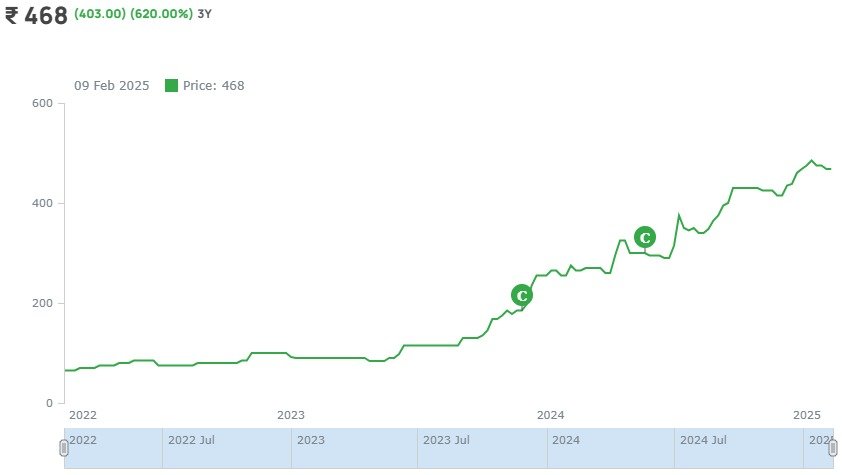
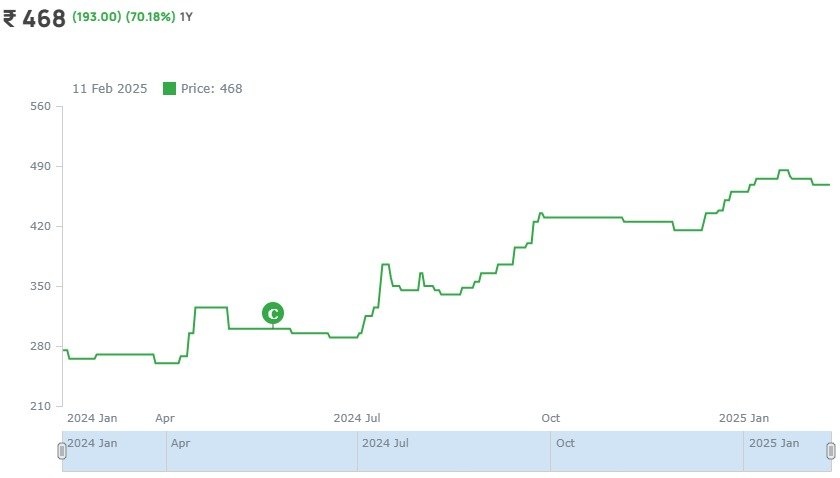
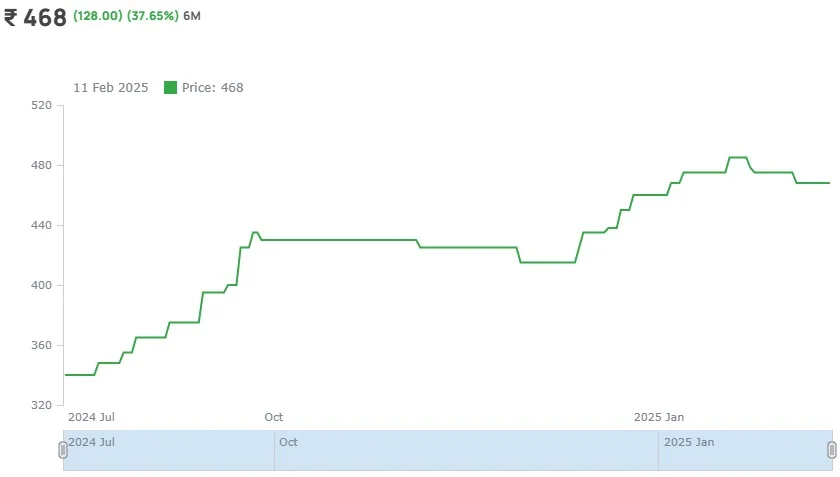
₹ 468
-
(403.00) (471.43%) 5Y
5 Year
3 Year
1 Year
6 Month
1 Month
About ORBIS FINANCIAL CORPORATION Unlisted Shares
1. Established in the year 2005 and headquartered in Gurugram, Haryana Orbis is a SEBI registered Custodian of Securities and a Clearing member in all the market segments in India having commenced commercial operations in 2009. It commenced its RTA services in 2019 as a SEBI accredited Registrar & Share Transfer Agent (R&T Agent) followed by Trustee services as a SEBI accredited Trustee services provider.
2. Orbis Financial Corporation Limited is a focussed financial services company dedicated towards Investor servicing in inter-related verticals namely Custody & Fund Accounting services, Commodity clearing, Equity derivatives clearing, Currency derivatives clearing, Share Transfer Agency and Trustee services.
3. Orbis Financials operates as an independent custodian and provides end-to-end services such as FPI registration, custodial services, fund accounting, clearing, depository and trusteeship services to its clients.
B) Clients of the Company
1. Orbis Financials Unlisted Share largely caters to institutional clients like FPI, portfolio management services (PMS), foreign direct investment (FDI), Domestic Institutional Investor (DII), and alternative investment funds (AIFs), particularly through its custodial business, and also provides clearing services to TMs and FPIs.
2. As of November 2021, the company caters to ~250 FPIs , ~100 PMS, ~50 AIF’s and ~1500 high net worth individuals(HNI)/non-resident individuals (NRIs).
C) Products of Orbis Financial Unlisted Share
1. Fund Accounting and customer reporting services
2. FX execution
3. Orbisonline
4. Designated depository participant services
5. Custody and clearing services
6. Derivative clearing services
7. Trustee services
8. Registrar and share transfer agency services (RTA services)
D) How Orbis Financial Makes Money?
Orbis Financial sources of revenue comprises of Treasury-Related Income, Custodial & and Clearing Income.
The company’s fee income remains annuity based (depending on AUC) and transaction oriented (linked to clearing volumes), which limits its exposure to market or credit risks to some extent.
E) Risk in Orbit Financial Business
1. Modest scale of operations. It also has modest market share of 0.35% in FY21-22. So, we will have to check the performance once their size become big.
2. The custodial business is exposed to concentration risks with the top ten clients accounting for ~51% of the overall Asset Under Custody as of September 2021.
3. As a Professional Clearing Member, the company reported an increase in clearing volumes to Rs. 13.2 lakh crore in FY2021 from Rs. 3.04 lakh crore in FY2019. However, the market share in terms of total volumes cleared remains marginal with equity derivatives at 0.23%, currency derivatives at 1.16%, commodity derivatives at 3.28% and the cash segment at 0.32% as of September 30, 2021.
4. Orbis Financials generates income from the Capital market. So, revenue and profitability remain vulnerable to market performance.
5. Currently, there are ~20 SEBI-registered custodial service providers comprising 15 bank promoted custodians, 4 promoted by financial institutions, and 1 individual-promoted custodian Orbis Financials. The industry ,however, remains dominated by bank custodians.
6. To onboard new clients, Orbis Financial has to rely on partners networks. So, Cost-to-income ratio which is, by dividing the operating expenses by the operating income generated. The Cost to Income Ratio is 74%, which means for Rs.100 Income, the cost is Rs.75. This remain elevated as Orbis Financial is a small player.
F) Orbis Unlisted Share Price: From Rs. 65 to Rs. 115
The journey from Rs. 65 to Rs. 115 has been nothing short of remarkable for the Orbis Unlisted Share Price, showing a 76% increase over a span of 12 months. This growth underscores several factors such as strong financial performance that have played pivotal roles in enhancing investor confidence and driving the Orbis Unlisted Share Price upwards.
Fundamentals
Per Equity Share
Financials (Figures in Cr.)
P&L Statement
| P&L Statement | 2021 | 2022 | 2023 | 2024 |
|---|---|---|---|---|
| Revenue | 66 | 154 | 297 | 424 |
| Cost of Material Consumed | 0 | 0 | 0 | 0 |
| Gross Margins | 100 | 100 | 100 | 100 |
| Change in Inventory | 0 | 0 | 0 | 0 |
| Employee Benefit Expenses | 20 | 22 | 40 | 79 |
| Other Expenses | 36 | 72 | 93 | 96 |
| EBITDA | 10 | 60 | 164 | 249 |
| OPM | 15.15 | 38.96 | 55.22 | 58.73 |
| Other Income | 20 | 37 | 3 | 7 |
| Finance Cost | 10 | 30 | 42 | 65 |
| D&A | 1 | 1 | 2 | 4 |
| EBIT | 9 | 59 | 162 | 245 |
| EBIT Margins | 13.64 | 38.31 | 54.55 | 57.78 |
| PBT | 19 | 66 | 122 | 187 |
| PBT Margins | 28.79 | 42.86 | 41.08 | 44.1 |
| Tax | 4 | 17 | 32 | 46 |
| PAT | 15 | 49 | 90 | 141 |
| NPM | 22.73 | 31.82 | 30.3 | 33.25 |
| EPS | 1.71 | 5.2 | 7.92 | 11.59 |
Financial Ratios |
2021 | 2022 | 2023 | 2024 |
|---|---|---|---|---|
| Operating Profit Margin | 15.15 | 38.96 | 55.22 | 58.73 |
| Net Profit Margin | 22.73 | 31.82 | 30.3 | 33.25 |
| Earning Per Share (Diluted) | 1.71 | 5.2 | 7.92 | 11.59 |
Balance Sheet
| Assets | 2021 | 2022 | 2023 | 2024 |
|---|---|---|---|---|
| Fixed Assets | 9 | 10 | 9.74 | 14 |
| CWIP | 0 | 0.2 | 0 | 0 |
| Investments | 827 | 92 | 162 | 97 |
| Trade Receivables | 12 | 8.8 | 30 | 35 |
| Inventory | 0 | 0 | 0 | 0 |
| Other Assets | 1453 | 3813 | 4838.26 | 4839 |
| Total Assets | 2301 | 3924 | 5040 | 4985 |
| Liabilities | 2021 | 2022 | 2023 | 2024 |
|---|---|---|---|---|
| Share Capital | 87.6 | 94.3 | 113.6 | 121.7 |
| FV | 10 | 10 | 10 | 10 |
| Reserves | 67.4 | 128.7 | 315.4 | 566 |
| Borrowings | 0 | 0 | 0 | 0 |
| Trade Payables | 16 | 31 | 77 | 64 |
| Other Liabilities | 2130 | 3670 | 4534 | 4233.3 |
| Total Liabilities | 2301 | 3924 | 5040 | 4985 |
Cash-Flow Statement
| Cash-Flow Statement | 2021 | 2022 | 2023 | 2024 |
|---|---|---|---|---|
| PBT | 19 | 66 | 122 | 187 |
| OPBWC | 30 | 60 | 170 | 273 |
| Change in Receivables | -3 | 4 | -21 | -5 |
| Change in Inventories | 0 | 0 | 0 | 0 |
| Change in Payables | 14 | 14 | 49 | -16 |
| Other Changes | 1193 | -507 | -354 | -176 |
| Working Capital Change | 1204 | -489 | -326 | -197 |
| Cash Generated From Operations | 1234 | -429 | -156 | 76 |
| Tax | -7 | -12 | -26 | -53 |
| Cash Flow From Operations | 1227 | -441 | -182 | 23 |
| Purchase of PPE | -0.7 | -1.7 | -1 | -5 |
| Sale of PPE | 0 | 0 | 0 | 0 |
| Cash Flow From Investment | -1008 | 768 | -77 | 66 |
| Borrowing | 0 | 0 | 0 | 0 |
| Divided | 0 | -3.5 | -5 | -9 |
| Equity | 22 | 23.6 | 115 | 103 |
| Others From Financing | 27.5 | -31 | -43 | -66 |
| Cash Flow from Financing | 49.5 | -10.9 | 67 | 28 |
| Net Cash Generated | 268.5 | 316.1 | -192 | 117 |
| Cash at the Start | 88 | 358 | 675 | 484 |
| Cash at the End | 358.5 | 674.1 | 483 | 601 |
Shareholding Pattern
Peer Ratio
| Particulars (cr) | Revenue (Fy24) | EPS (FY24) | Mcap (21.10.24) | P/E (21.10.24) |
| ORBIS FINANCIAL CORPORATION | 14780 | 34 | 470250 | 55x |
| BSE | 1592 | 57 | 57203 | 96x |
ORBIS FINANCIAL CORPORATION Unlisted Shares
₹ 468


Buy or sell shares with ease – Contact Us Today!