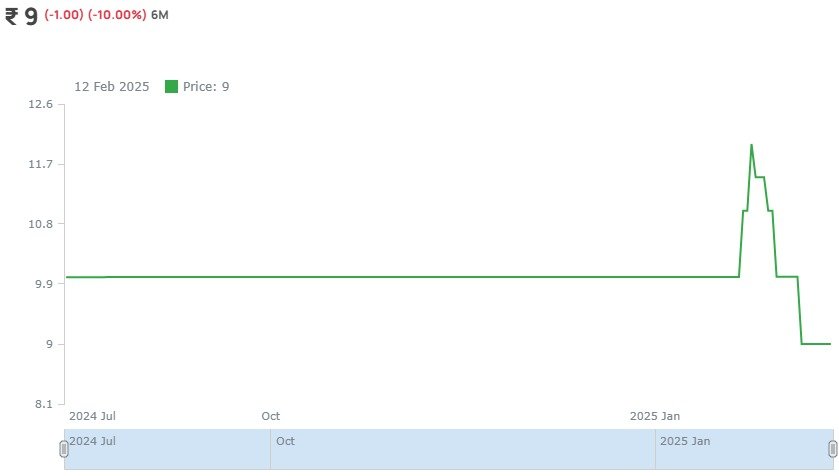
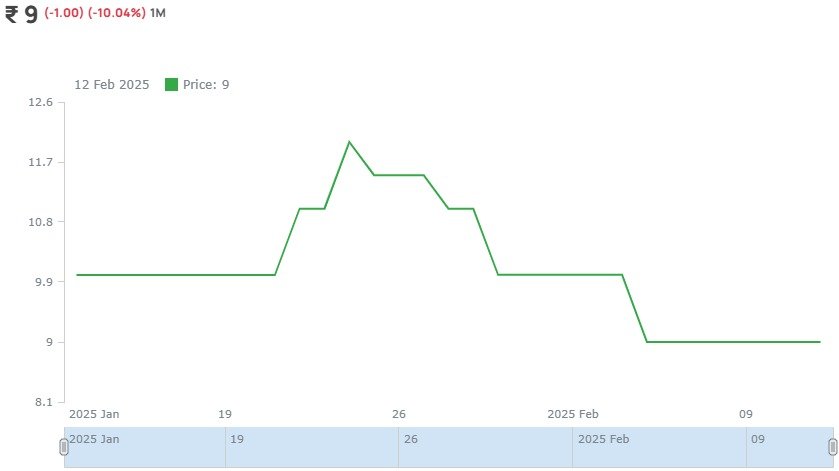
15 Days Price Change
PharmEasy Unlisted Shares
-
PharmEasy

-
414719

PharmEasy Unlisted Shares
-
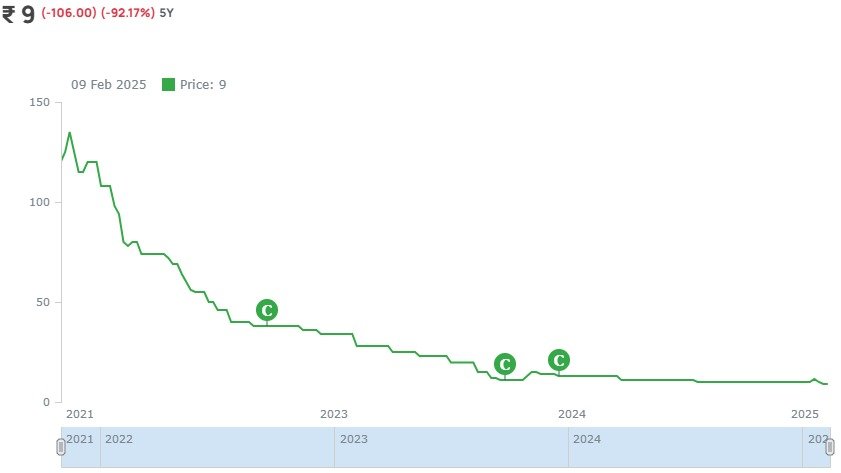
₹ 9
-
(-106.00) (-92.17%) 5Y
5 Year
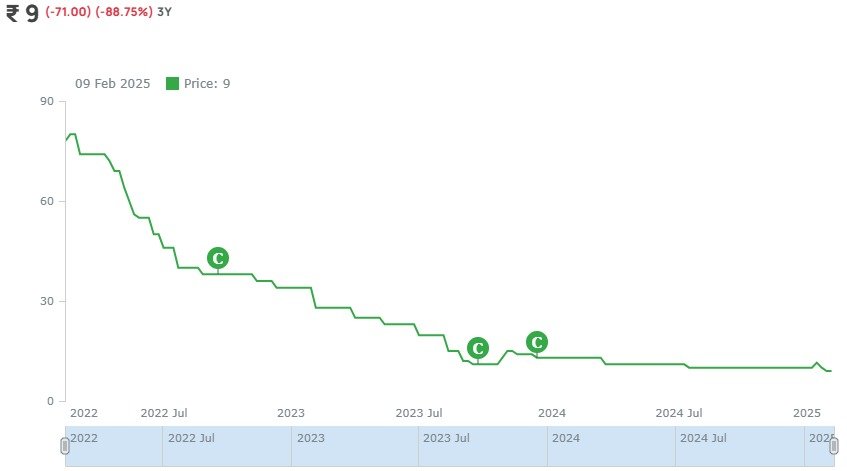
3 Year
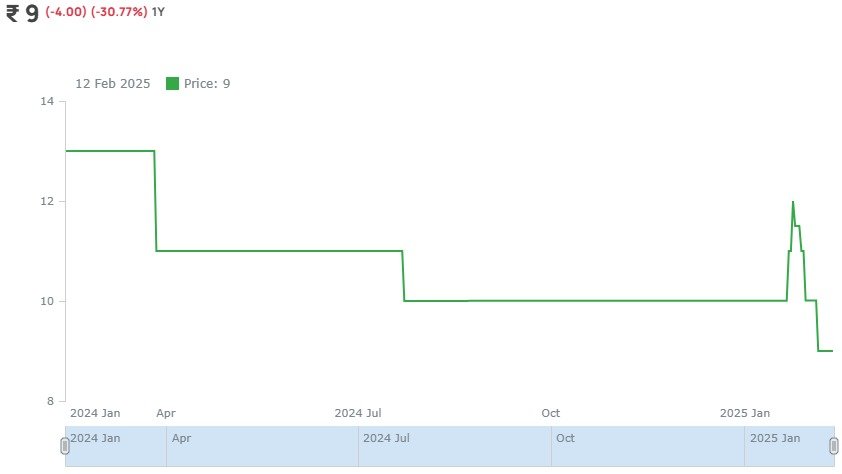
1 Year
6 Month
1 Month
About PharmEasy Unlisted Shares
Pharmeasy Share Price Full Details About the
Company
PharmEasy is India's leading digital healthcare
platform. It provides information, consultations, diagnostics tests, medicines,
healthcare products, and services from registered and trusted pharmacies, leading
diagnostic laboratories, and trusted doctors across India, serving every habitable
zip code of the country. The journey of PharmEasy was started in 2015, when founders
Dharmil Sheth, an MBA from IMT Ghaziabad and Dr. Dhaval Shah, MBBS from Rajiv Gandhi
Medical College and MBA from XLRI Jamshedpur, came up with the idea of an online
pharmacy to make healthcare affordable and accessible to one and all.
Overview of PharmEasy
They are India’s largest
digital healthcare platform (based on GMV of products and services sold for the year
ended March 31, 2021), according to RedSeer Report. They operate an integrated,
end-to-end business that aims to provide solutions for the healthcare needs of
consumers across the following critical stages A. providing digital tools and
information on illness and wellness.
B. Offering Teleconsultation.
C. Offering diagnostics and Radiology tests.
D. delivering treatment
protocols including products and devices. PharmEasy custom-built proprietary
technology, unified data platforms, supply chain capabilities, and a deep
understanding of the dynamic interplay between the various sub-segments of India’s
healthcare market are the capabilities that differentiate us.
These
capabilities enable PharmEasy to provide each stakeholder in the healthcare
value-chain, viz.: (a) channel (wholesalers, retailers, and chemists/institutions).
(b) consultants (and hospitals), diagnostic and radiology labs. (c) consumers (d)
companies (pharmaceutical, nutraceutical,medical devices.
The businesses have
a presence across the country, with last-mile 163 capabilities to deliver in over
18,587 pin codes (for June 2021) via PharmEasy marketplace, allowing the ability to
provide access in an affordable manner to the common man. The platforms have scaled
across urban, semi-urban, and rural India, with an ability to serve people across
income groups and geographies.
Journey of PharmEasy
2015 - Started the journey in Mumbai and received angel
funding.
2016 - Received Series-A funding and expanded into
5 cities. The same year they have started a home-diagnostics service.
2017 - Received Series-B funding and expanded into 700
cities. Launched online delivery of health care products.
2018 - Received Series-C funding and expanded PAN India
presence.
2019 - Received Series-D funding and expanded
more than 22000+ PIN codes.
2020- It has got merged with
Ascent Health and 5 other companies to form API Holdings, to form India’s biggest
online healthcare company.
2021 - It has purchased 66%
stakes in Thyrocare and this is the first listed company to be acquired by any
Unicorn in India. Currently, there is a team of 4000+ dedicated employees and have
more than 10000+ retail stores working 24*7 to ensure medicines are delivered on
time and at the best possible prices.
Funding History
| March 2016 | ~34 Crores |
| March 2017 | ~104 Crores |
| April 2017 | ~13 Crores |
| February 2018 | ~13 Crores |
| September 2018 | ~350 Crores |
| September 2018 | ~2800 Crores |
| November 2019 | ~1650 Crores |
| April 2021 | ~2400 Crores |
| June 2021 | ~150 Crores |
Product and Services
If you check the website of PharmaEasy,
you will find the following services;
(i) Order Online
Medicine
How does it work?
Step-1: The
buyer needs to upload the prescription. Once PharmEasy receives it, they verify and
send the same to the Medical stores near the pin code.
Step-2: PhameEasy delivery agent then collects medicine
from Pharmacy and delivers it to the user.
(ii) Healthcare
Products Similar to buying the medicine you can buy various healthcare
products such as Nutritions, Personal care, Skin Care, Ayurvedic Products,
Life-Style Ailments Products.
(iii) Diagnostics Tests Under
this service, you can book diagnostics tests under PharmEasy labs. PharmEasy labs is
a diagnostic service offered by its partner lab Medlife Labs directly. Medlife is
now being acquired by PharmEasy. As they have recently acquired Thyrocare, they are
giving the option to book tests for these labs as well.
PharmEasy
Business Model
The business model is very simple and
straightforward. It connects buyers, suppliers, and distributors. Buyer has the
option to choose services such as Medicine, Health-Care Products, book diagnostic
tests, etc from the application and website. They get 1-2% commission on selling
medicines, they get advertisement money for displaying products of various
pharmaceuticals, Nutraceuticals, companies, etc., and also get income from
diagnostics tests.
Fundamentals
Per Equity Share
Financials (Figures in Cr.)
P&L Statement
| P&L Statement | 2021 | 2022 | 2023 | 2024 |
|---|---|---|---|---|
| Revenue | 2335 | 5729 | 6644 | 5664 |
| Cost of Material Consumed | 2267 | 5342 | 5669 | 4737 |
| Gross Margins | 2.91 | 6.76 | 14.67 | 16.37 |
| Change in Inventory | -114 | -229 | 62 | 143 |
| Employee Benefit Expenses | 270 | 1459 | 1283 | 699 |
| Other Expenses | 482 | 1502 | 1051 | 731 |
| EBITDA | -570 | -2345 | -1421 | -646 |
| OPM | -24.41 | -40.93 | -21.39 | -11.41 |
| Other Income | 25 | -1185 | -2866 | 931 |
| Finance Cost | 43 | 258 | 666 | 728 |
| D&A | 33 | 159 | 243 | 216 |
| EBIT | -603 | -2504 | -1664 | -862 |
| EBIT Margins | -25.82 | -43.71 | -25.05 | -15.22 |
| PBT | -621 | -3977 | -5196 | -2522 |
| PBT Margins | -26.6 | -69.42 | -78.21 | -44.53 |
| Tax | 21 | 22 | 15 | 11 |
| PAT | -642 | -3999 | -5211 | -2533 |
| NPM | -27.49 | -69.8 | -78.43 | -44.72 |
| EPS | -25.08 | -6.51 | -8.48 | -3.9 |
Financial Ratios |
2021 | 2022 | 2023 | 2024 |
|---|---|---|---|---|
| Operating Profit Margin | -24.41 | -40.93 | -21.39 | -11.41 |
| Net Profit Margin | -27.49 | -69.8 | -78.43 | -44.72 |
| Earning Per Share (Diluted) | -25.08 | -6.51 | -8.48 | -3.9 |
Balance Sheet
| Assets | 2021 | 2022 | 2023 | 2024 |
|---|---|---|---|---|
| Fixed Assets | 128 | 1025 | 912 | 734 |
| CWIP | 0.2 | 7.8 | 4 | 3.6 |
| Investments | 1 | 438 | 342 | 329 |
| Trade Receivables | 358 | 861 | 905 | 706 |
| Inventory | 406 | 761 | 688 | 556 |
| Other Assets | 4011.8 | 8305.2 | 5405 | 6061.4 |
| Total Assets | 4905 | 11398 | 8256 | 8390 |
| Liabilities | 2021 | 2022 | 2023 | 2024 |
|---|---|---|---|---|
| Share Capital | 25.6 | 614.2 | 614.2 | 649.6 |
| FV | 1 | 1 | 1 | 1 |
| Reserves | 3555.4 | 6408.3 | 1823 | 1938 |
| Borrowings | 585 | 2585 | 4120 | 4098 |
| Trade Payables | 365 | 459 | 413 | 413 |
| Other Liabilities | 374 | 1331.5 | 1285.8 | 1291.4 |
| Total Liabilities | 4905 | 11398 | 8256 | 8390 |
Cash-Flow Statement
| Cash-Flow Statement | 2021 | 2022 | 2023 | 2024 |
|---|---|---|---|---|
| PBT | -620 | -3971 | -5196 | -2522 |
| OPBWC | -427 | -1474 | -637 | -214 |
| Change in Receivables | -99 | -226 | -112 | 30 |
| Change in Inventories | -112 | -195 | 73 | 133 |
| Change in Payables | 74 | -18 | -45 | -0.5 |
| Other Changes | -238 | -592 | 39 | 26.5 |
| Working Capital Change | -375 | -1031 | -45 | 189 |
| Cash Generated From Operations | -802 | -2505 | -682 | -25 |
| Tax | -12 | -84 | -62 | -36 |
| Cash Flow From Operations | -814 | -2589 | -744 | -61 |
| Purchase of PPE | -31 | -143 | -95 | -72 |
| Sale of PPE | 1 | 5 | 8 | 10 |
| Cash Flow From Investment | 4 | -5789 | -72 | -1261 |
| Borrowing | 15 | 2016 | 652 | -231 |
| Divided | 0 | 0 | -23 | -29.5 |
| Equity | 399.2 | 6344 | 548 | 2000 |
| Others From Financing | 605.8 | -55 | -324 | -282.5 |
| Cash Flow from Financing | 1020 | 8305 | 853 | 1457 |
| Net Cash Generated | 210 | -73 | 37 | 135 |
| Cash at the Start | 20 | 230 | 157 | 192 |
| Cash at the End | 230 | 157 | 194 | 327 |
Shareholding Pattern
Peer Ratio
| Particulars (cr) | Revenue (Fy24) | PAT (Fy24) | P/E (17/01/2025) | Mcap (17/01/2025) |
| NCDEX | 96 | -29 | NA | 1500 Cr |
| MCX | 684 | 83 | 88x | 30000 Cr |