
15 Days Price Change
Sambhv Steel Unlisted Shares
-
Sambhv Steel

-
22943

Sambhv Steel Unlisted Shares
-
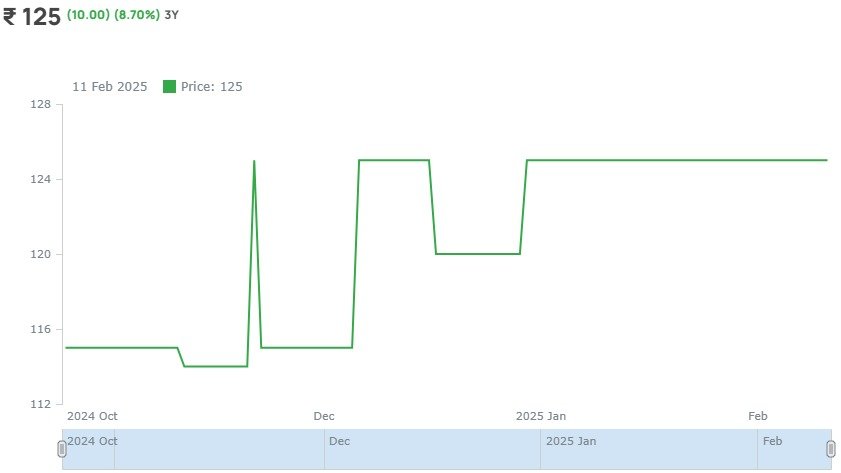
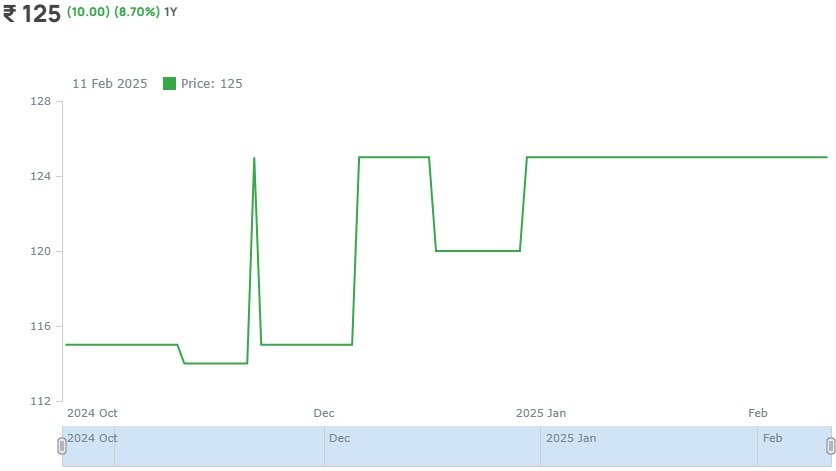
₹ 125
-
(10.00) (8.70%) 5Y
5 Year

3 Year
1 Year
6 Month

1 Month
About Sambhv Steel Unlisted Shares
A) About Sambhv Pipes
1. They are one of the largest Manufacturers of steel products with capacity about 6 lac metric tons annually under the brand Sambhv Steel. They have a vertically integrated plant in Raipur.
2. They are engaged in the manufacturing of Hot-Rolled Coils, Cold- Rolled Coils, MS
ERW Pipes & Tubes (Black & Galvanised) and hollow section pipes conforming
to various domestic and international Product standards.
3. They have a
rich experience in the steel industries for over 2 decades, they have come a long
way in assuring supremacy in quality, dedication and customer satisfaction, from
manufacturing to innovating and building a dynamic team.
B) Sponge Iron to Steel Production?
1. Production of Sponge Iron- Sambhv Sponge Power ventured into this segment in 2017 and over the years it has become one of the prominent names in sponge iron manufacturing with a capacity of 90,000 MTPA. Sponge Iron is mostly used as a raw material for manufacturing high-quality steel products. Sponge iron is a highly processed form of iron ore that contains metallic iron in the range of 83-88% obtained by direct reduction through reaction with carbon in the form of coal at approx.
2. Bloom Casting ( Semi Finished Steel Product ) - Once the liquid steel meets the desired specifications, it is cast into blooms. Blooms are semi-finished rectangular or square cross-section bars, which serve as the base material for further processing into various steel products. Sambhv has the capability to produce 12,000 tonnes of these high-quality blooms annually.
3. Then These Blooms are used to make final steel products as per Industry Need.
C) Types of Products
1. Coils-
a) Hot - Rolled Coils-
(i) Sambhv steel manufactures Hot Rolled (HR) coils of the highest quality at its state-of-the-art fully automated Hot Strip mills.
(ii) The Products comply with various Indian and International Standards.
(iii) Industry Served - Automatic Clutch Plates, Wheels & wheel rims, Pipes & Tubes, Agricultural equipment, Metal building, Industrial & Engineering parts
b) Cold-Rolled Coils
(i) Sambhv Steel's CR coils are cold-rolled for enhanced hardness and strength, allowing for deformation resistance. They can be further shaped or galvanized in their fully hard state.
(ii) Industry Served- Automobiles, Appliances, and Furniture
3. Pipes and Structural Tubes-
a) ERW Steel Pipes & Tubes
b) HDG Pipes & Tubes
4. Steel Door Frames
a) Single Door
b) Double Door
D) 9MFY24 Financials Statistics of Sambhav Pipe
a) HR Pipe contributes 68% , GI Pipes 7%, Billets 15% and Other 10% in total Revenue.
b) 9MFY24 sales is INR 927 Cr, EBITDA of INR 123 Cr and PAT of INR 92 Cr.
c) In the Q1FY24, the sales in (MT) was 39860, Q2FY24 it was 46536 and in Q3FY24 it is 47307. So, good growth is seen in the QoQ.
d) HR Pipe realisation in Q3FY24 was ~INR 53000 and in GI Pipe it is ~INR 67541. The realisation in the GI Pipe is high which indicates higher margin product.
e) HR Pipe currently operating at 76% capacity and GI Pipe at 21%.
E) Recent Pre-IPO Fund Raise
Company is planning a Green Field expansion via 600 Cr capex. Out of that it has raised ~INR 150 Cr in the Pre-IPO round in Sept-23;
1. Rs. 110 crores have been allocated for the purchase of a rolling mill and other ancillary machines.
2. Rs. 25 crores have been placed in the form of a fixed deposit.
3. Rs. 15.37 crores have been parked in a CC account and will be utilized for capex as and when required.
Fundamentals
Per Equity Share
Financials (Figures in Cr.)
P&L Statement
| P&L Statement | 2021 | 2022 | 2023 | 2024 |
|---|---|---|---|---|
| Revenue | 479 | 819 | 936 | 1287 |
| Cost of Material Consumed | 386 | 660 | 749 | 967 |
| Gross Margins | 19.42 | 19.41 | 19.98 | 24.86 |
| Change in Inventory | 2 | -28 | -30 | -13 |
| Employee Benefit Expenses | 14 | 20 | 37 | 50 |
| Other Expenses | 13 | 47 | 66 | 125 |
| EBITDA | 64 | 120 | 114 | 158 |
| OPM | 13.36 | 14.65 | 12.18 | 12.28 |
| Other Income | 1 | 6 | 5 | 6 |
| Finance Cost | 15 | 18 | 22 | 30 |
| D&A | 6 | 10 | 16 | 21 |
| EBIT | 58 | 110 | 98 | 137 |
| EBIT Margins | 12.11 | 13.43 | 10.47 | 10.64 |
| PBT | 44 | 98 | 82 | 112 |
| PBT Margins | 9.19 | 11.97 | 8.76 | 8.7 |
| Tax | 10 | 25 | 20 | 29 |
| PAT | 34 | 73 | 62 | 83 |
| NPM | 7.1 | 8.91 | 6.62 | 6.45 |
| EPS | 17 | 36.5 | 31 | 3.44 |
Financial Ratios |
2021 | 2022 | 2023 | 2024 |
|---|---|---|---|---|
| Operating Profit Margin | 13.36 | 14.65 | 12.18 | 12.28 |
| Net Profit Margin | 7.1 | 8.91 | 6.62 | 6.45 |
| Earning Per Share (Diluted) | 17 | 36.5 | 31 | 3.44 |
Balance Sheet
| Assets | 2021 | 2022 | 2023 | 2024 |
|---|---|---|---|---|
| Fixed Assets | 114 | 235 | 292 | 293 |
| CWIP | 60 | 17 | 21 | 231 |
| Investments | 0 | 0 | 0 | 0 |
| Trade Receivables | 8 | 16 | 17 | 52 |
| Inventory | 35 | 121 | 141 | 148 |
| Other Assets | 53 | 69 | 62 | 139 |
| Total Assets | 270 | 458 | 533 | 863 |
| Liabilities | 2021 | 2022 | 2023 | 2024 |
|---|---|---|---|---|
| Share Capital | 20 | 20 | 20 | 241 |
| FV | 10 | 10 | 10 | 10 |
| Reserves | 58 | 131 | 191 | 203 |
| Borrowings | 141 | 241 | 267 | 271 |
| Trade Payables | 20 | 21 | 19 | 73 |
| Other Liabilities | 31 | 45 | 36 | 75 |
| Total Liabilities | 270 | 458 | 533 | 863 |
Cash-Flow Statement
| Cash-Flow Statement | 2021 | 2022 | 2023 | 2024 |
|---|---|---|---|---|
| PBT | 44 | 98 | 82 | 112 |
| OPBWC | 64.69 | 126.23 | 119.53 | 163 |
| Change in Receivables | 5.25 | -8 | -1.51 | -35 |
| Change in Inventories | 6.62 | -86 | -19.93 | -6 |
| Change in Payables | 0 | 0 | 0 | 0 |
| Other Changes | -22.55 | 19.36 | 3.47 | 39 |
| Working Capital Change | -10.68 | -74.64 | -17.97 | -2 |
| Cash Generated From Operations | 54.01 | 51.59 | 101.56 | 161 |
| Tax | -8.37 | -20.43 | -17.39 | -25 |
| Cash Flow From Operations | 45.64 | 31.16 | 84.17 | 136 |
| Purchase of PPE | -7.75 | -131.45 | -74.75 | -23 |
| Sale of PPE | 0 | 0.19 | 1.86 | 0 |
| Cash Flow From Investment | -56.88 | -95.71 | -86.13 | -262 |
| Borrowing | 21.21 | 83.44 | 25.61 | 13 |
| Divided | 0 | 0 | 0 | 0 |
| Equity | 0 | 0 | 0 | 4 |
| Others From Financing | -14.95 | -18.23 | -21.74 | 108.5 |
| Cash Flow from Financing | 6.26 | 65.21 | 3.87 | 125.5 |
| Net Cash Generated | -4.98 | 0.66 | 1.91 | -0.5 |
| Cash at the Start | 5.78 | 0.8 | 1.47 | 3.4 |
| Cash at the End | 0.8 | 1.46 | 3.38 | 2.9 |
Shareholding Pattern
Peer Ratio
| Particulars (cr) | Revenue (Fy24) | PAT (Fy24) | P/E (17/01/2025) | Mcap (17/01/2025) |
| NCDEX | 96 | -29 | NA | 1500 Cr |
| MCX | 684 | 83 | 88x | 30000 Cr |