
15 Days Price Change
Spray Engineering Devices Unlisted Shares
-
Spray Engineering Devices

-
916668

Spray Engineering Devices Unlisted Shares
-
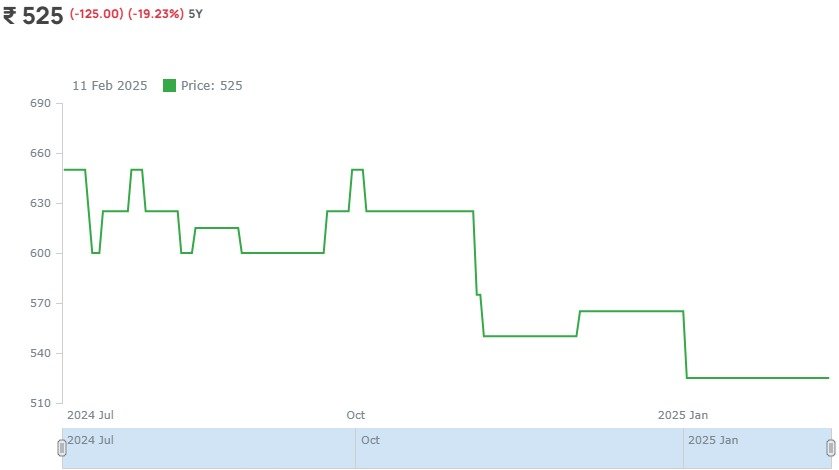
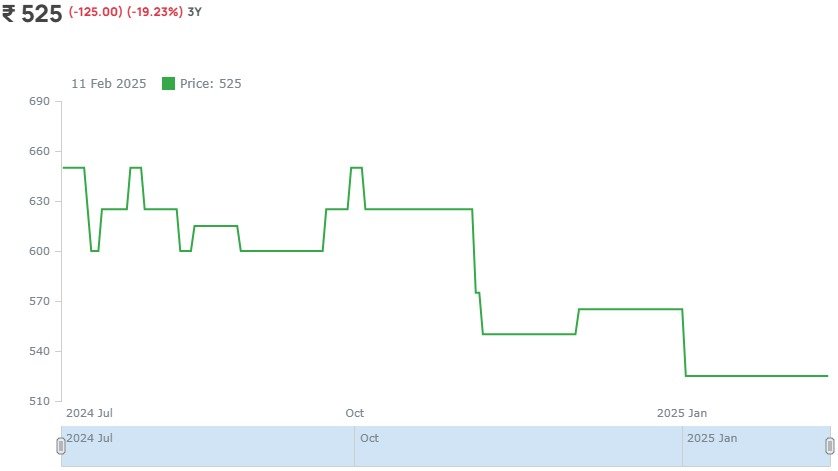
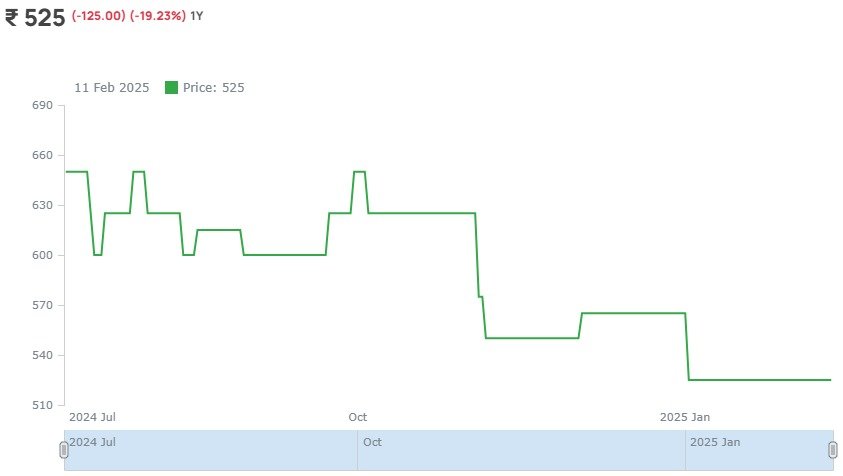
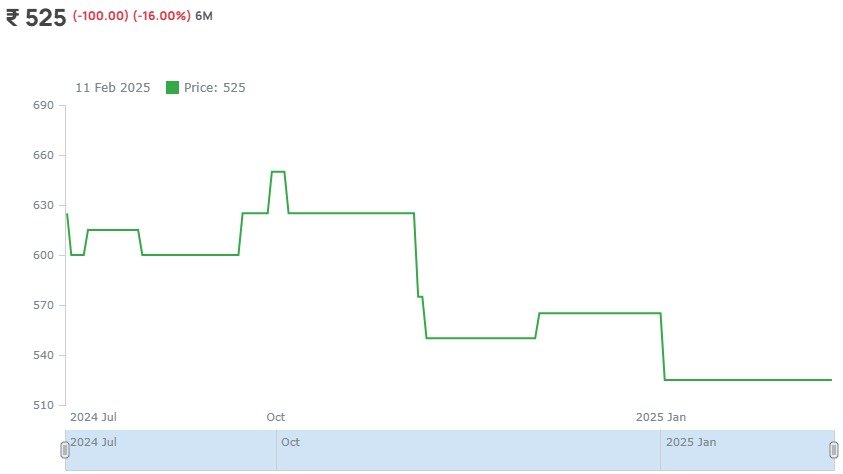
₹ 525
-
(-125.00) (-19.23%) 5Y
5 Year
3 Year
1 Year
6 Month
1 Month
About Spray Engineering Devices Unlisted Shares
1) Established in 2004, initially focused on manufacturing spray nozzles, and has since evolved into a global leader in energy-efficient solutions.
2) Operates across diverse sectors, including sugar, bio-refinery, distillery, jaggery, biofuel, water, and bio-based green chemicals.
3) Operates in over 40 countries, providing expertise in processes such as evaporation, crystallization, and refining.
4) Specializes in integrated energy-saving equipment and solutions for the sugar and allied industries, recognized for enhancing operational efficiency and sustainability.
5) Engages in manufacturing, designing, process engineering, advisory, EPC, and R&D, employing 1,200 skilled professionals. Recognized by the Department of Scientific & Industrial Research (DSIR), Government of India.
Business Verticals:
Spray Engineering Devices Limited (SED) is a global leader in energy-efficient solutions for sugar and allied industries. Sugar, Biofuel, Bio-Refinery, Distillery, Jaggery, Biofuel, Water and Bio Based Green Chemicals.
Innovative Technologies
a) Low-Temperature Evaporation System
SED has developed an efficient, eco-friendly low-temperature evaporation system designed for recycling wastewater into clean water. This system is utilised in over 100 plants globally, achieving significant reductions in steam consumption and power usage while promoting sustainable water use.
b) Boiler-Free Jaggery Production Unit
SED has also established a boiler-free jaggery production unit, capable of producing solid, semi-solid, powder, and cake jaggery. This technology ensures 100% bagasse saving, presenting a profitable and sustainable business proposition.
R&D and Production Facilities
- R&D Unit: Granted in-house R&D unit status by the Government of India in 2007
- Fabrication Units: Three modern fabrication and automation units located in Baddi, Himachal Pradesh, India.
Enhanced Industry Efficiency
SED's solutions have been successfully commissioned in over 500 sugar factories in India, achieving significant enhancements in industry efficiency:
- Steam Consumption: Reduced to 25-26% on cane
- Power Usage: Lowered to 22-24 kW/Ton
- Fresh Water Usage: Achieves zero fresh water usage in over 600 installations
Eco-Friendly Wastewater Recycling
In the past 5-6 years, SED has made significant strides in developing and implementing eco-friendly wastewater recycling systems. These systems are operational in over 100 plants worldwide, transforming wastewater into clean water and promoting environmental sustainability.
Domestic Projects
SED has been involved in various significant domestic projects in India, including:
- Sugar Projects: Bajaj Group, Dalmia Group, DSCL Group, Birla Group, Triveni Sugar Group, and more
- Water Projects: Dr. Reddy’s Lab, Sun Pharma, Cipla India, JK Cement, TATA Chemicals, Pidlite Industries, and more
International Projects
SED's international presence is marked by major projects with renowned companies in Dubai, South Africa, Nigeria, Kenya, Poland, Brazil, Indonesia and in the USA.
Fundamentals
Per Equity Share
Financials (Figures in Cr.)
P&L Statement
| P&L Statement | 2021 | 2022 | 2023 | 2024 |
|---|---|---|---|---|
| Revenue | 111 | 214 | 392 | 547 |
| Cost of Material Consumed | 61 | 147 | 255 | 341 |
| Gross Margins | 45.05 | 31.31 | 34.95 | 37.66 |
| Change in Inventory | 1 | -6 | -7 | 6 |
| Employee Benefit Expenses | 21 | 28 | 39 | 47 |
| Other Expenses | 15 | 24 | 51 | 66 |
| EBITDA | 13 | 21 | 54 | 87 |
| OPM | 11.71 | 9.81 | 13.78 | 15.9 |
| Other Income | 1 | 1 | 1 | 1 |
| Finance Cost | 6 | 5 | 8 | 10 |
| D&A | 2 | 2 | 3 | 5 |
| EBIT | 11 | 19 | 51 | 82 |
| EBIT Margins | 9.91 | 8.88 | 13.01 | 14.99 |
| PBT | 5 | 15 | 45 | 74 |
| PBT Margins | 4.5 | 7.01 | 11.48 | 13.53 |
| Tax | 0 | 0 | 12 | 21 |
| PAT | 5 | 15 | 33 | 53 |
| NPM | 4.5 | 7.01 | 8.42 | 9.69 |
| EPS | 2.23 | 6.69 | 14.71 | 23.56 |
Financial Ratios |
2021 | 2022 | 2023 | 2024 |
|---|---|---|---|---|
| Operating Profit Margin | 11.71 | 9.81 | 13.78 | 15.9 |
| Net Profit Margin | 4.5 | 7.01 | 8.42 | 9.69 |
| Earning Per Share (Diluted) | 2.23 | 6.69 | 14.71 | 23.56 |
Balance Sheet
| Assets | 2021 | 2022 | 2023 | 2024 |
|---|---|---|---|---|
| Fixed Assets | 24 | 26 | 54 | 76 |
| CWIP | 0 | 1 | 13 | 13 |
| Investments | 0 | 0 | 0.26 | 0.4 |
| Trade Receivables | 30 | 43 | 60 | 87 |
| Inventory | 48 | 66 | 78 | 76 |
| Other Assets | 22 | 48 | 58.74 | 49.6 |
| Total Assets | 124 | 184 | 264 | 302 |
| Liabilities | 2021 | 2022 | 2023 | 2024 |
|---|---|---|---|---|
| Share Capital | 22.43 | 22.43 | 22.43 | 22.5 |
| FV | 10 | 10 | 10 | 10 |
| Reserves | 1 | 16 | 49 | 101 |
| Borrowings | 21 | 19 | 58 | 75 |
| Trade Payables | 37 | 32 | 39 | 56 |
| Other Liabilities | 42.57 | 94.57 | 95.57 | 47.5 |
| Total Liabilities | 124 | 184 | 264 | 302 |
Cash-Flow Statement
| Cash-Flow Statement | 2021 | 2022 | 2023 | 2024 |
|---|---|---|---|---|
| PBT | 5 | 15 | 45 | 74 |
| OPBWC | 9 | 17 | 48 | 91 |
| Change in Receivables | -7 | -12 | -17 | -30 |
| Change in Inventories | -7 | -18 | -12 | 2 |
| Change in Payables | -9 | -5 | 7 | 15 |
| Other Changes | 24 | 37 | -12 | -52 |
| Working Capital Change | 1 | 2 | -34 | -65 |
| Cash Generated From Operations | 10 | 19 | 14 | 26 |
| Tax | 0 | 0 | 0 | -7 |
| Cash Flow From Operations | 10 | 19 | 14 | 19 |
| Purchase of PPE | -3 | -5 | -43 | -30 |
| Sale of PPE | 0 | 0 | 0 | 0 |
| Cash Flow From Investment | -5 | -4 | -42 | -28 |
| Borrowing | 0.24 | 6.5 | -3 | 17.5 |
| Divided | 0 | 0 | 0 | 0 |
| Equity | 0.76 | 0 | 0 | 0 |
| Others From Financing | -6 | -15.5 | 34 | -9.5 |
| Cash Flow from Financing | -5 | -9 | 31 | 8 |
| Net Cash Generated | 0 | 6 | 3 | -1 |
| Cash at the Start | 0.24 | 5 | 11 | 1.4 |
| Cash at the End | 0.24 | 11 | 14 | 0.4 |
Shareholding Pattern
Peer Ratio
| Particulars (cr) | Revenue (Fy24) | EPS (FY24) | Mcap (21.10.24) | P/E (21.10.24) |
| Spray Engineering Devices | 14780 | 34 | 470250 | 55x |
| BSE | 1592 | 57 | 57203 | 96x |
Spray Engineering Devices Unlisted Shares
₹ 525


Buy or sell shares with ease – Contact Us Today!